Quantiles and Percentiles, Clearly Explained!!!
TL;DR
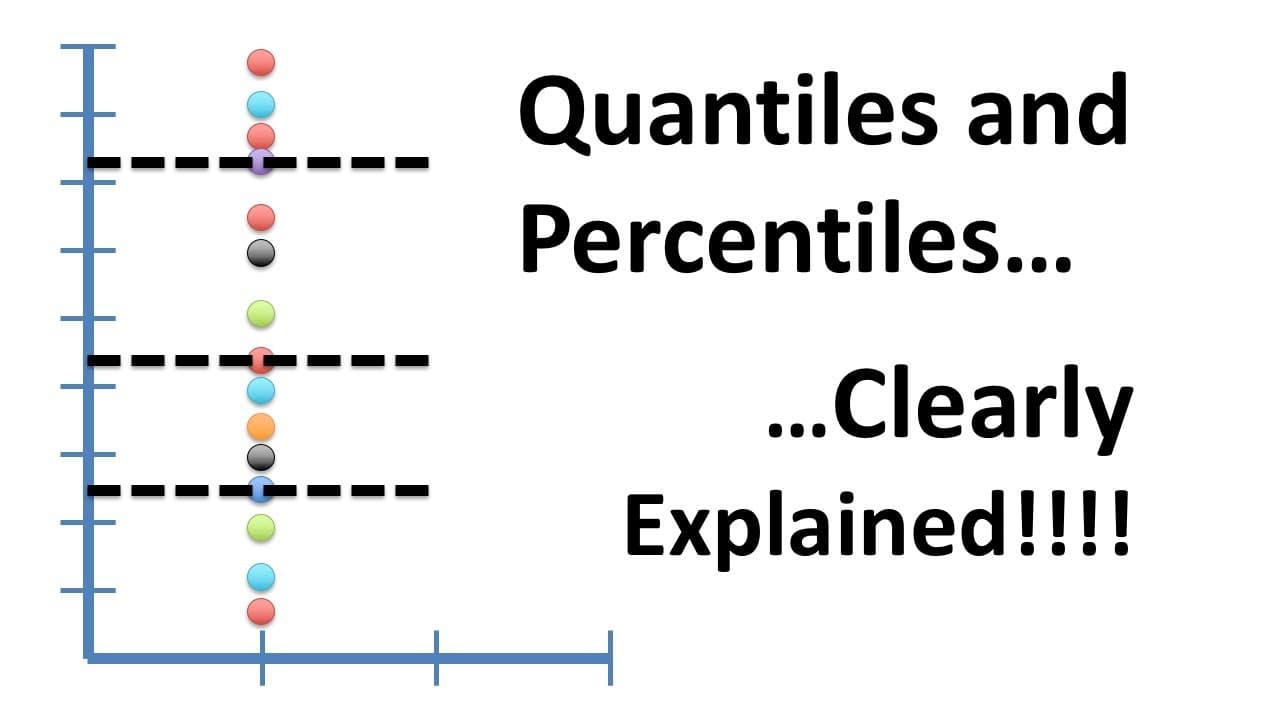
Exploring how quantiles and percentiles divide data into groups, with practical examples and multiple calculation methods.
Transcript
sted quest is special yes it is stat quest hello i'm josh star and welcome to stat quest stat quest is brought to you by the friendly folks in the genetics department at the University of North Carolina at Chapel Hill today we're going to be talking about quantiles and percentiles and they're gonna be clearly explained I thought putting this stat q... Read More
Key Insights
- 👥 Quantiles divide data into equally sized groups, with the median as the 0.5 quantile.
- 👥 Percentiles are quantiles dividing data into 100 groups but terminologies are flexible.
- 🛩️ Calculation methods for quantiles can vary results, especially in smaller datasets.
- ❓ Practical examples show how quantiles and percentiles are used in data analysis.
- ❓ Understanding quantiles and percentiles is crucial for interpreting data distribution.
- 🥺 Different quantile calculation methods can lead to variations in results.
- ❓ Quantile plots and normalization techniques are crucial in data analysis.
Install to Summarize YouTube Videos and Get Transcripts
Explore YouTube Video Summarizer or Get YouTube Transcript Extractor
Questions & Answers
Q: What is the difference between quantiles and percentiles?
Quantiles divide data into equally sized groups, while percentiles specifically divide data into 100 equally sized groups. In practice, the terminology is more flexible, referring to percentiles as specific quantiles.
Q: How do different calculation methods affect quantile values?
Various calculation methods for quantiles can result in slightly different values, especially in smaller datasets. It is important to consider the sample size and method used when interpreting quantile results.
Q: Can you provide an example of quantiles and percentiles in a dataset?
Yes, quantiles like the median (0.5 quantile) split data into equal groups, while percentiles divide data into 100 groups. For instance, the 25th percentile would be the 0.25 quantile, dividing data into four groups with 25% below the value.
Q: Why are quantile and percentile calculations important in statistics?
Quantiles and percentiles provide valuable insights into data distribution, allowing for comparisons and understanding of relative positioning within a dataset. Different methods of calculation can be useful in various contexts for data analysis.
Summary & Key Takeaways
-
Quantiles divide data into equally sized groups, with the median being the 0.5 quantile.
-
Percentiles are quantiles that divide data into 100 equally sized groups, with terminology flexibility in practice.
-
Different calculation methods for quantiles can result in varying results, with more consistency in larger datasets.
Read in Other Languages (beta)
Share This Summary 📚
Summarize YouTube Videos and Get Video Transcripts with 1-Click
Try YouTube Summary with ChatGPT & Claude or YouTube Transcript Generator
Explore More Summaries from StatQuest with Josh Starmer 📚
Summarize YouTube Videos and Get Video Transcripts with 1-Click
Try YouTube Summary with ChatGPT & Claude or YouTube Transcript Generator