What Does the February 2023 Forex Market Analysis Reveal?

TL;DR
The February 2023 Forex market analysis suggests a potential decline in the Dollar Index, which may create upside opportunities for currencies like the Euro and Pound. Key levels on the Euro-Dollar and NASDAQ charts indicate possible upward movements if specific thresholds are crossed, and understanding order block and gap theory is essential for accurate trading decisions.
Transcript
good afternoon folks help everybody's doing well all right so this is a quick little review and this will probably be it for this week for me I have a lot of personal things I have to take care of and deal with with my wife and our home we have some things that they're still getting unpacked and take care of that stuff so my trading room still has ... Read More
Key Insights
- 📈 The dollar index is showing signs of a sustained decline, potentially leading to upside opportunities in other currencies like the pound and euro.
- 💰 The euro dollar daily chart has taken out the buy side, but a fair value gap could provide the next draw for liquidity if the market animates to the upside.
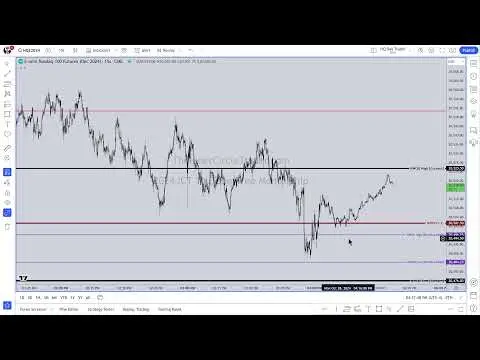
- 📉 The Nasdaq daily chart is approaching a key level, and a break above it could lead to a bullish trend.
- 🏛 The order block theory and gap theory are distinct but have similarities, and understanding their nuances is crucial for successful trading.
- 🌐 The pound dollar is bullish unless it breaks below a specific low, which could indicate a shift in market structure.
- ⚖️ The e-mini S&P chart has experienced a shift in market structure, and a break above a certain high could result in a bullish sentiment.
- 🔄 Understanding the intricacies of daily, hourly, and minute charts is crucial for identifying key levels and predicting market movements.
- 🧐 Proper analysis and study of charts, including identifying imbalances, highs, lows, and order blocks, are essential for successful trading and avoiding misinformation.
Install to Summarize YouTube Videos and Get Transcripts
Explore YouTube Video Summarizer or Get YouTube Transcript Extractor
Questions & Answers
Q: What is the potential target for the Dollar Index's decline?
The content suggests that if the decline in the Dollar Index is sustained, the potential target could be below the current low, even reaching the 101 big figure.
Q: What would invalidate the bullish outlook on Pound-Dollar?
The bullish outlook on Pound-Dollar would be invalidated if it breaks below a specific low identified in the analysis.
Q: What are the key levels and patterns to watch on the Euro-Dollar daily chart?
The key levels to watch on the Euro-Dollar daily chart are the buy-side liquidity pool and the fair value gap, with a potential target of 125 even big figure. The analysis also mentions that trading below the midpoint of a down closed candle could change the outlook.
Q: What are the levels to keep an eye on for potential price movements on the NASDAQ?
The NASDAQ's daily chart highlights key levels, including an old high and a fair value gap, which could lead to price movements. The content also mentions the importance of wicks and gaps in understanding the market dynamics.
Summary & Key Takeaways
-
The daily chart of the Dollar Index indicates a potential decline, with a target below the current low.
-
The Euro-Dollar daily chart suggests a possible upward movement if it breaks above a specific level.
-
The NASDAQ daily chart shows key levels and patterns to watch for potential price movements.
Read in Other Languages (beta)
Share This Summary 📚
Summarize YouTube Videos and Get Video Transcripts with 1-Click
Try YouTube Summary with ChatGPT & Claude or YouTube Transcript Generator
Explore More Summaries from The Inner Circle Trader 📚


Summarize YouTube Videos and Get Video Transcripts with 1-Click
Try YouTube Summary with ChatGPT & Claude or YouTube Transcript Generator