Graphing Linear Equations, No. 2

TL;DR
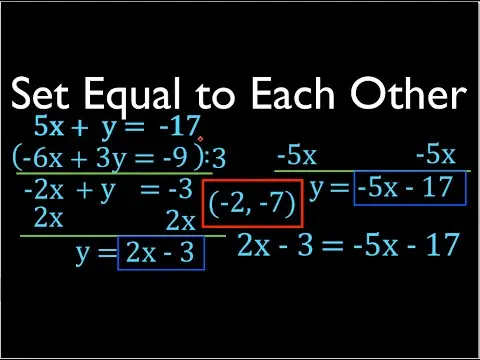
Learn to graph linear functions using y=mx+b format, identifying y-intercepts and slopes for accurate plotting.
Transcript
okay in today's video I'm going to show you how to graph the following six linear functions let's get started this is the y-axis this is the x-axis you will notice that in this video all of the all of the equations are already in the form y equals MX plus B which we like to call the slope-intercept form y equals MX plus B there are two important th... Read More
Key Insights
- 🏙️ Y-intercepts mark where lines cross the y-axis, while slopes determine the direction and steepness of the line.
- 📈 Positive slopes slope upward on the graph, negative slopes slope downward, and a slope of zero creates a horizontal line.
- 😀 Graphing linear functions involves plotting points using the y-intercept and slope to accurately represent the function graphically.
- 💁♂️ Understanding the y=mx+b format simplifies the process of identifying and graphing linear functions effectively.
- 😀 Recognizing the importance of y-intercepts and slopes is essential for accurate graphing of linear functions.
- 😀 Writing down y-intercepts and slopes aids in the identification and correct plotting of points for graphing linear functions.
- 🫥 Linear functions with zero slopes produce horizontal lines, while those with zero intercepts have vertical lines.
Install to Summarize YouTube Videos and Get Transcripts
Explore YouTube Video Summarizer or Get YouTube Transcript Extractor
Questions & Answers
Q: What is the significance of the y-intercept in graphing linear functions?
The y-intercept is crucial as it marks where the line intersects the y-axis, providing a starting point for plotting the graph accurately.
Q: How does the slope impact the direction of a linear function on a graph?
The slope determines the direction of the line, with positive slopes sloping upward, negative slopes sloping downward, and a slope of zero producing a horizontal line.
Q: Why is it important to write down both the y-intercept and slope when graphing linear functions?
Writing down the y-intercept and slope helps in easy identification and accurate plotting of the points needed to graph the linear function correctly.
Q: How does the equation format y=mx+b help in understanding and graphing linear functions?
The y=mx+b format provides a clear indication of the slope (m) and y-intercept (b), making it easier to interpret and graph linear functions effectively.
Summary & Key Takeaways
-
Tutorial on graphing linear functions in y=mx+b format using y-intercept and slope.
-
Emphasis on identifying y-intercepts as the point where lines cross the y-axis and slopes as rise over run.
-
Demonstrates plotting points for linear functions with various slopes and y-intercepts.
Read in Other Languages (beta)
Share This Summary 📚
Summarize YouTube Videos and Get Video Transcripts with 1-Click
Try YouTube Summary with ChatGPT & Claude or YouTube Transcript Generator
Explore More Summaries from Step by Step Science 📚


Summarize YouTube Videos and Get Video Transcripts with 1-Click
Try YouTube Summary with ChatGPT & Claude or YouTube Transcript Generator