Example of non linear regression dose response data in GraphPad Prism
TL;DR
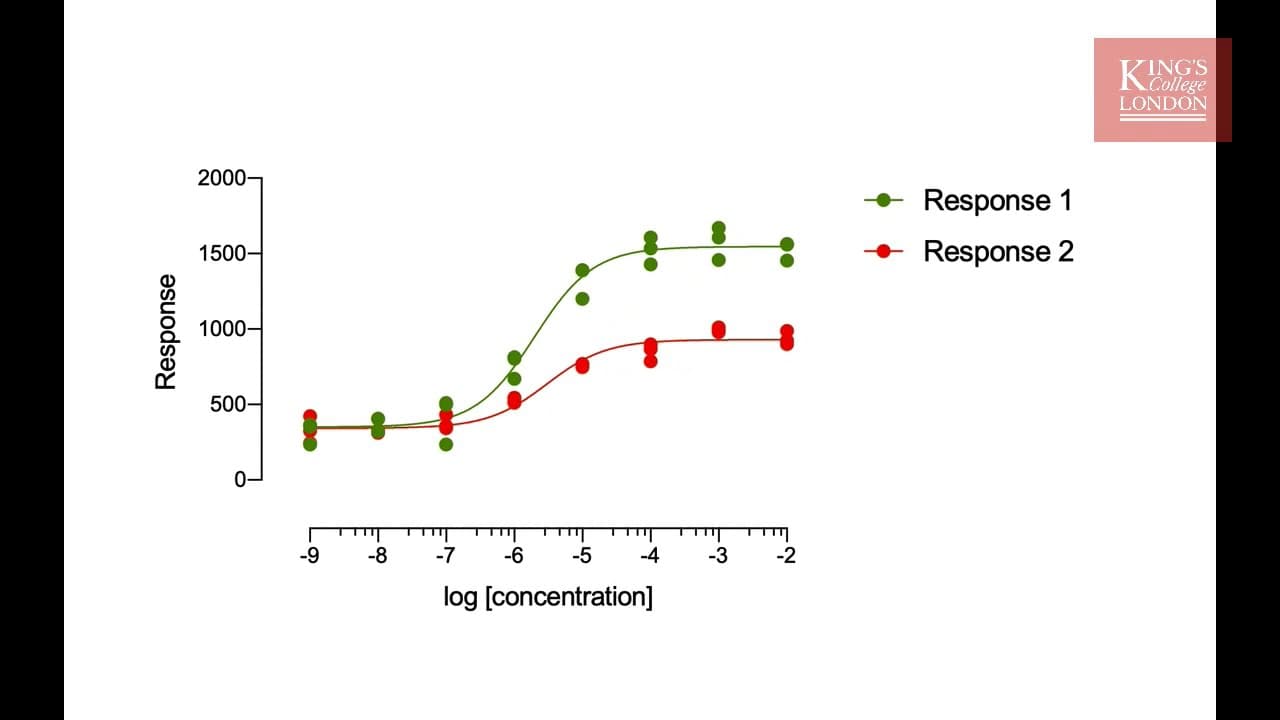
This video explains how to use nonlinear regression in GraphPad Prism to analyze dose-response and dose-inhibition data.
Transcript
hello I'm James Clark from King's College London and in this brief video I'm going to look at non linear regression in graphpad prism unlike linear regression which simply involves plotting a straight line through data non linear regression can involve a number of different nonlinear models the use of these models will of course depend upon your ex... Read More
Key Insights
- 🅰️ Nonlinear regression in GraphPad Prism is useful for analyzing various types of data, including dose-response, dose-inhibition, and biochemical interaction data.
- 🧡 Users can choose from a range of nonlinear models and parameters to fit their data, selecting the model that best fits their experimental design.
- 🤕 The software provides options to handle outliers, calculate confidence intervals, and plot confidence and prediction bands.
- 👻 Prism allows for the comparison of different curve fits and hypothesis testing to determine the best-fitting model for the data.
Install to Summarize YouTube Videos and Get Transcripts
Explore YouTube Video Summarizer or Get YouTube Transcript Extractor
Questions & Answers
Q: What is the difference between linear and nonlinear regression?
Linear regression involves fitting a straight line through data, while nonlinear regression involves fitting data to nonlinear models. Linear regression is suitable for linear relationships, while nonlinear regression is used for relationships that cannot be represented linearly.
Q: Why is log concentration often used in dose-response studies?
Log concentration is often used in dose-response studies because it converts the relationship between concentration and response from hyperbolic to sigmoid, making it easier to determine parameters like EC50 (half-maximal effective concentration).
Q: How can GraphPad Prism handle outliers in data?
GraphPad Prism provides options to handle outliers, including the ability to detect and eliminate outliers during the regression analysis. This ensures that outliers do not affect the curve fitting and parameter estimation.
Q: How can GraphPad Prism interpolate unknown values from a standard fitted curve?
Users can enter their curve data and the response data for unknowns, and Prism can interpolate the corresponding log concentration values based on the fitted curve. Confidence intervals can also be calculated for the interpolated values.
Summary & Key Takeaways
-
Nonlinear regression involves fitting data to nonlinear models and is used for enzyme kinetics studies, biochemical interactions, and more.
-
GraphPad Prism allows users to perform nonlinear regression analysis on data and offers various options for model selection and parameter estimation.
-
The software can handle outliers, calculate confidence intervals, detect and eliminate outliers, and interpolate unknown values from a standard fitted curve.
Read in Other Languages (beta)
Share This Summary 📚
Summarize YouTube Videos and Get Video Transcripts with 1-Click
Try YouTube Summary with ChatGPT & Claude or YouTube Transcript Generator
Explore More Summaries from Dory Video 📚


Summarize YouTube Videos and Get Video Transcripts with 1-Click
Try YouTube Summary with ChatGPT & Claude or YouTube Transcript Generator