How to Debug Node.js Code Using Console Logs
TL;DR
To debug Node.js applications effectively, use console.log statements to trace execution flow and identify issues. This method is often faster and easier than setting up a debugger, especially for beginners. By systematically checking functions and logging their outputs, you can pinpoint where the code is failing and resolve bugs efficiently.
Transcript
so one of the things that you need to become better at when you're learning how to program is how to debug so i've been coding for almost 10 years now and this is the main approach i like to take when i'm debugging applications now in this video i want to show you more like a javascript approach of how you can debug node js code and this is a reall... Read More
Key Insights
- 👨💻 Debugging is an essential skill for all programmers, impacting the efficiency of coding and problem-solving.
- 🧑💻 Console logs serve as a straightforward and effective method for tracking program execution and identifying errors.
- 💋 In cases where code is stuck or crashing, systematically checking individual functions and their outputs can help pinpoint the problem.
- 👨💻 Beginners are encouraged to harness simple debugging techniques, such as console logging, to gain confidence and understanding in their coding practices.
- 👻 The approach of isolating code sections and commenting them out can simplify the debugging process by allowing developers to eliminate potential sources of errors one at a time.
- 🔠 Testing functions with sample inputs can reveal flaws in logic, especially in a development context where unexpected behavior arises.
- 👨💻 The speaker’s experience indicates that simplicity often trumps complexity when troubleshooting code, particularly for novice coders.
Install to Summarize YouTube Videos and Get Transcripts
Explore YouTube Video Summarizer or Get YouTube Transcript Extractor
Questions & Answers
Q: Why is debugging an important skill for programmers?
Debugging is crucial because it allows programmers to efficiently identify and fix errors in their code. Understanding debugging enhances problem-solving skills, which are vital in development. Without effective debugging, even experienced programmers can face significant delays, as bugs can lead to system failures or incorrect outputs.
Q: What is the initial step the presenter takes when debugging the sample code?
The presenter starts by running the application to understand its behavior with and without command-line arguments. This helps determine if the issue lies within argument handling. By confirming that the application throws an error when no arguments are provided, the presenter narrows down the location of the potential bug.
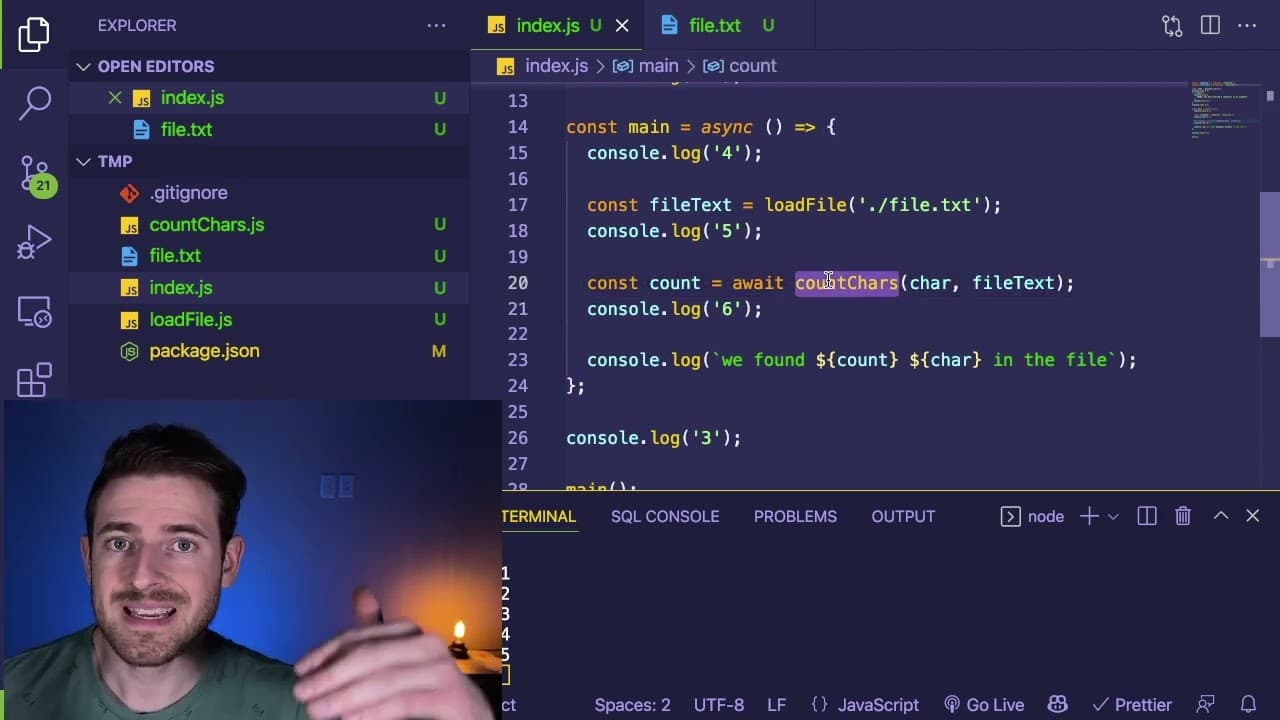
Q: How do console logs help in debugging according to the video?
Console logs provide real-time feedback on where the program is executing. By inserting them at various points in the code, developers can trace the program's flow and identify where it stops or behaves unexpectedly. This method can quickly reveal the source of the issue without the complexity of setting up a debugger.
Q: What alternative debugging method does the presenter mention, and why might it be less favorable?
The alternative method mentioned is using a debugger, which, while powerful, can be complicated. The presenter highlights that the setup process can be cumbersome and time-consuming, especially when dealing with transpiled code. The preference for console logs stems from their simplicity and speed, facilitating a rapid debugging process.
Q: What can be inferred about the effectiveness of the console log method?
The presenter suggests that using console logs is effective for quickly identifying issues without extensive setup. By consistently printing out execution indicators, developers can easily trace the program's operation and isolate the line causing the problem, making this method practical especially for beginners.
Q: How does the presenter deal with a situation where there is an infinite loop in the code?
When facing an infinite loop, the presenter describes the process of commenting out problematic functions to isolate the issue. This step ensures that the remaining code runs correctly, indicating that the problem resides within the commented-out function, thus facilitating focused debugging to resolve the infinite loop.
Summary & Key Takeaways
-
The video discusses fundamental debugging techniques for Node.js developers, emphasizing the importance of understanding where and why code breaks.
-
The presenter recommends using console logs to track execution flow and identify issues, arguing it can be more efficient than setting up a debugger.
-
An example Node.js application demonstrates how to identify and resolve a bug by methodically checking different parts of the code.
Read in Other Languages (beta)
Share This Summary 📚
Summarize YouTube Videos and Get Video Transcripts with 1-Click
Try YouTube Summary with ChatGPT & Claude or YouTube Transcript Generator
Explore More Summaries from Web Dev Cody 📚


Summarize YouTube Videos and Get Video Transcripts with 1-Click
Try YouTube Summary with ChatGPT & Claude or YouTube Transcript Generator