How to Use Sigma Notation for Riemann Sums
TL;DR
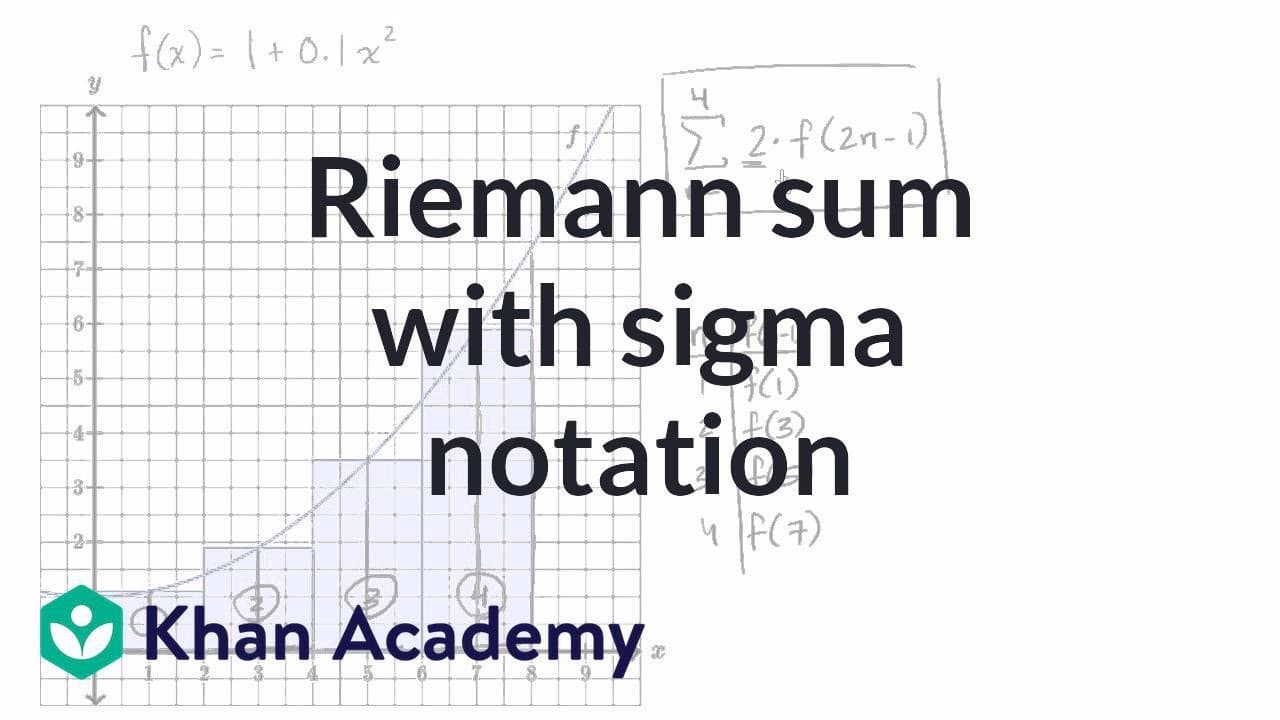
Approximating the area under a curve with Riemann sums involves dividing the area into rectangles and using sigma notation to sum their areas. Each rectangle's height is determined by evaluating the function at midpoints, while the width remains constant. This method allows for accurate area estimation through mathematical expressions.
Transcript
Voiceover: What I want to do in this video, is get a little bit of practice trying to approximate the area under curves, and also get a little bit more familiarity with the sigma notation in this context. So what we have here, we have the graph of f of x is equal to one plus 0.1 x squared, that's this curve right over here, and then we have these r... Read More
Key Insights
- 😑 Sigma notation is a powerful tool for expressing approximations of areas using rectangles.
- 🖐️ The width and height of each rectangle play a crucial role in the accuracy of the approximation.
- 🆘 Mapping between sigma notation and the actual calculation helps understand the relationship between the two.
- 🍉 Evaluating the approximation involves substituting function values, multiplying, and summing the terms.
Install to Summarize YouTube Videos and Get Transcripts
Explore YouTube Video Summarizer or Get YouTube Transcript Extractor
Questions & Answers
Q: How is the area under the curve approximated using rectangles?
The area is approximated by dividing the interval into equal sections and multiplying each section's width by the height of the corresponding midpoint on the curve.
Q: What is the formula for sigma notation in this context?
The formula is Σ(n=1 to 4) [2 * f(2n-1)], where f represents the function and n represents the rectangle number.
Q: Why is the height of each rectangle based on the midpoint value of the function?
Using the midpoint value ensures that the approximation considers the function's behavior within each rectangle and avoids over or underestimation.
Q: How is the approximation evaluated?
The approximation is evaluated by substituting the corresponding values of f(n) into the sigma notation formula, multiplying each term by two, and summing them up.
Summary & Key Takeaways
-
The video explains how to approximate the area under a curve using rectangles and sigma notation.
-
The function f(x) = 1 + 0.1x^2 is graphed, and four rectangles are used to estimate the area under the curve.
-
Each rectangle has a width of two and a height based on the midpoint value of the function within the interval.
-
Sigma notation is used to express the sum of the areas of the rectangles as an approximation of the area under the curve.
Read in Other Languages (beta)
Share This Summary 📚
Summarize YouTube Videos and Get Video Transcripts with 1-Click
Try YouTube Summary with ChatGPT & Claude or YouTube Transcript Generator
Explore More Summaries from Khan Academy 📚


Summarize YouTube Videos and Get Video Transcripts with 1-Click
Try YouTube Summary with ChatGPT & Claude or YouTube Transcript Generator