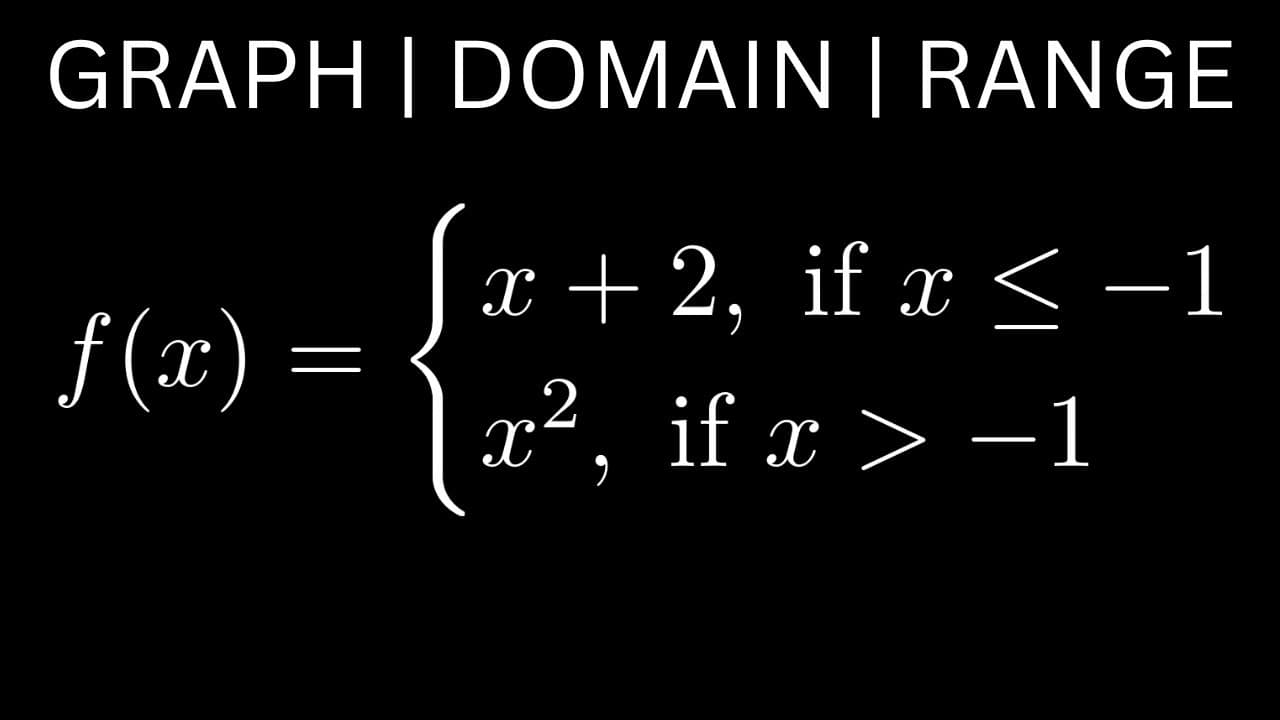
Graph The Piecewise Function and Find the Domain and Range (Parabola and Line Example)
TL;DR
Learn how to graph a piecewise function, find the domain and range, and identify holes in the graph.
Transcript
hi in this video we're going to graph this piecewise function we're going to find the domain and we're also going to find the range let's go ahead and jump into its solution start by drawing the y-axis and also the x-axis so here's X and here's y okay so let's go ahead and graph this one first the bottom piece so whenever you have a less than or a ... Read More
Key Insights
- 📈 Graphing a piecewise function involves starting with the bottom piece and considering any holes in the graph.
- ❣️ The y-value of a hole can be found by breaking the rules and substituting the x-value of the hole into the function.
- 😣 The rest of the graph can be plotted based on the given conditions for the function.
- ❣️ The domain of the function encompasses all real numbers since any x-value yields a corresponding y-value.
- 📈 The range of the function extends infinitely downwards and upwards, as indicated by the arrows on the graph.
- 🔯 Solid dots indicate filled-in points where the function is defined, while holes represent undefined points in the graph.
- 📈 The slope of the graph can be determined from the given conditions of the piecewise function.
Install to Summarize YouTube Videos and Get Transcripts
Explore YouTube Video Summarizer or Get YouTube Transcript Extractor
Questions & Answers
Q: How do you find the y-value of a hole in a piecewise function?
To find the y-value of a hole, you can plug in the x-value of the hole into the relevant piece of the function. Although this breaks the rules, it is a trick that always works. For example, if the x-value of the hole is -1, you would substitute -1 into the function to find the corresponding y-value.
Q: What is the significance of a solid dot versus a hole in a graph?
A solid dot indicates a filled-in point on the graph, which means the function is defined at that particular coordinate. A hole, on the other hand, represents an undefined point in the graph due to a break in the piecewise function. It is typically shown as an unfilled circle.
Q: How do you determine the domain of a piecewise function?
The domain of a piecewise function is the set of all x-values that produce valid y-values on the graph. In this example, since any valid x-value along the x-axis results in a corresponding y-value on the graph, the domain would be all real numbers (-∞, ∞).
Q: What does the arrow on the graph indicate for the range of the function?
The arrow on the graph signifies that the range extends infinitely in a particular direction. In this case, the arrow pointing downwards represents that there are infinitely many y-values reaching negative infinity. The arrow going upwards indicates infinitely many y-values extending to positive infinity.
Summary & Key Takeaways
-
The video explains how to graph a piecewise function by starting with the bottom piece and finding any holes.
-
It demonstrates the process of finding the y-value of a hole by breaking the rules and plugging the x-value into the function.
-
The video also covers graphing the rest of the piecewise function and determining the x-intercept, domain, and range.
Read in Other Languages (beta)
Share This Summary 📚
Summarize YouTube Videos and Get Video Transcripts with 1-Click
Try YouTube Summary with ChatGPT & Claude or YouTube Transcript Generator
Explore More Summaries from The Math Sorcerer 📚


Summarize YouTube Videos and Get Video Transcripts with 1-Click
Try YouTube Summary with ChatGPT & Claude or YouTube Transcript Generator