How to Sketch a Vector Valued Function and Find Orientation and Rectangular Form
TL;DR
Learn how to graph vector valued functions and determine their orientation using rectangular form and a simple table.
Transcript
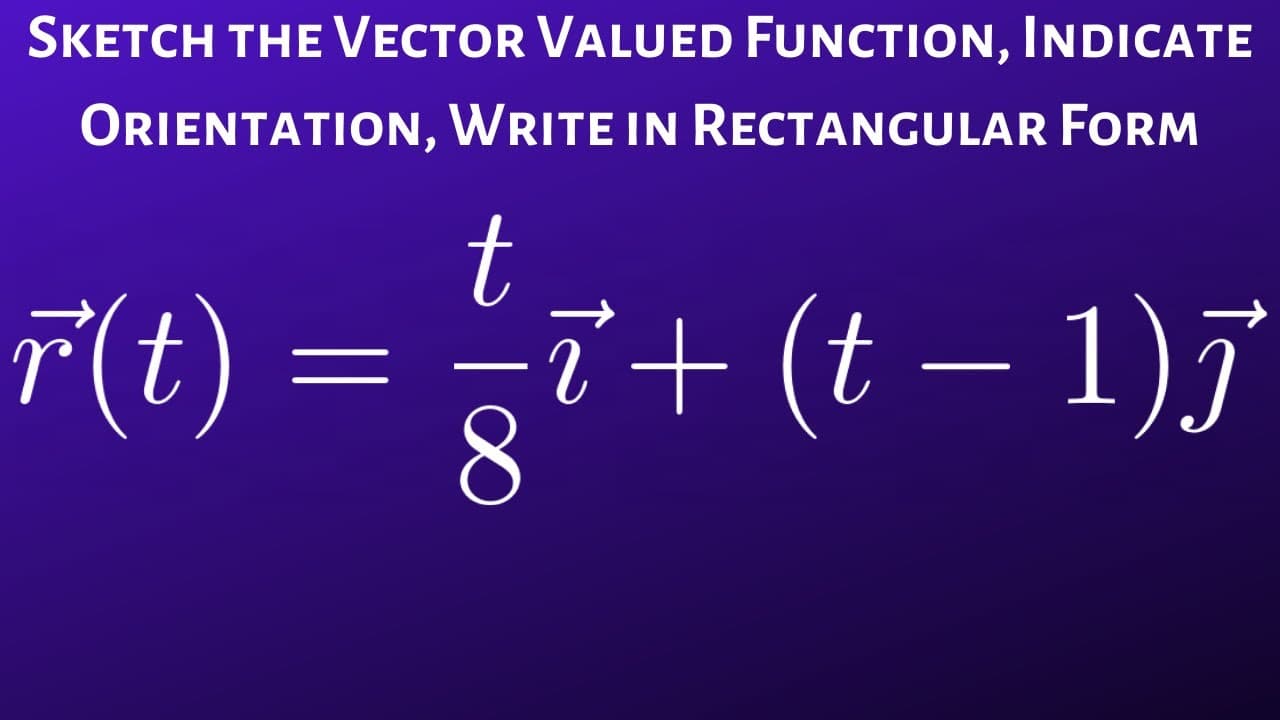
and this problem we're going to sketch the graph of this vector valued function and indicate the orientation so by looking at it you can tell it's going to be a straight line because everything is to the first power here you have T to the one here you have T to the one we call that you can write this in component form if you like you can write it a... Read More
Key Insights
- 😑 Vector valued functions with straight lines can be expressed in rectangular form, making graphing easier.
- 🔌 Plugging in values of T and observing the corresponding X and Y components helps in understanding the shape of the graph.
- 👻 Rectangular form allows for solving equations simultaneously and simplifies the process of finding the orientation.
- ❓ The orientation of a graphed vector valued function can be determined by analyzing the direction of the plot and whether it is increasing or decreasing.
- ⌛ Creating a table with increasing values of T helps visualize the movement of the vector over time.
- 💁 Using the rectangular form and table method, it is possible to accurately graph and determine the orientation of vector valued functions.
- 🏑 Graphing vector valued functions is a useful tool in various fields, such as physics and engineering.
Install to Summarize YouTube Videos and Get Transcripts
Explore YouTube Video Summarizer or Get YouTube Transcript Extractor
Questions & Answers
Q: How do you graph a vector valued function?
To graph a vector valued function, plug in values of T and plot the corresponding X and Y components. Connect the points to create a line representing the function.
Q: What is rectangular form in vector valued functions?
Rectangular form in vector valued functions involves expressing the X component as the equation T/8 and the Y component as the equation T - 1. This form facilitates graphing and calculations.
Q: How do you find the orientation of a graphed vector valued function?
To determine the orientation, create a table with increasing values of T and calculate the corresponding X and Y components. Observe the direction in which the vector is moving to determine the orientation of the graph.
Q: Can you explain the process of graphing vector valued functions in rectangular form further?
To graph in rectangular form, solve for T in one equation (T = 8X) and substitute it into the other equation (Y = 8X - 1). Plot the coordinates on the X-Y plane and connect the dots to form a line. Remember to use arrows to indicate the orientation.
Summary & Key Takeaways
-
A vector valued function is graphed by plugging in values of T and plotting the corresponding X and Y components.
-
To graph in rectangular form, solve for T in one equation and substitute it into the other equation.
-
To determine the orientation, create a table with increasing values of T and observe the direction of the graph.
Read in Other Languages (beta)
Share This Summary 📚
Summarize YouTube Videos and Get Video Transcripts with 1-Click
Try YouTube Summary with ChatGPT & Claude or YouTube Transcript Generator
Explore More Summaries from The Math Sorcerer 📚


Summarize YouTube Videos and Get Video Transcripts with 1-Click
Try YouTube Summary with ChatGPT & Claude or YouTube Transcript Generator