Why Does Dividing by n−1 Give an Unbiased Variance Estimate? | Khan Academy
TL;DR
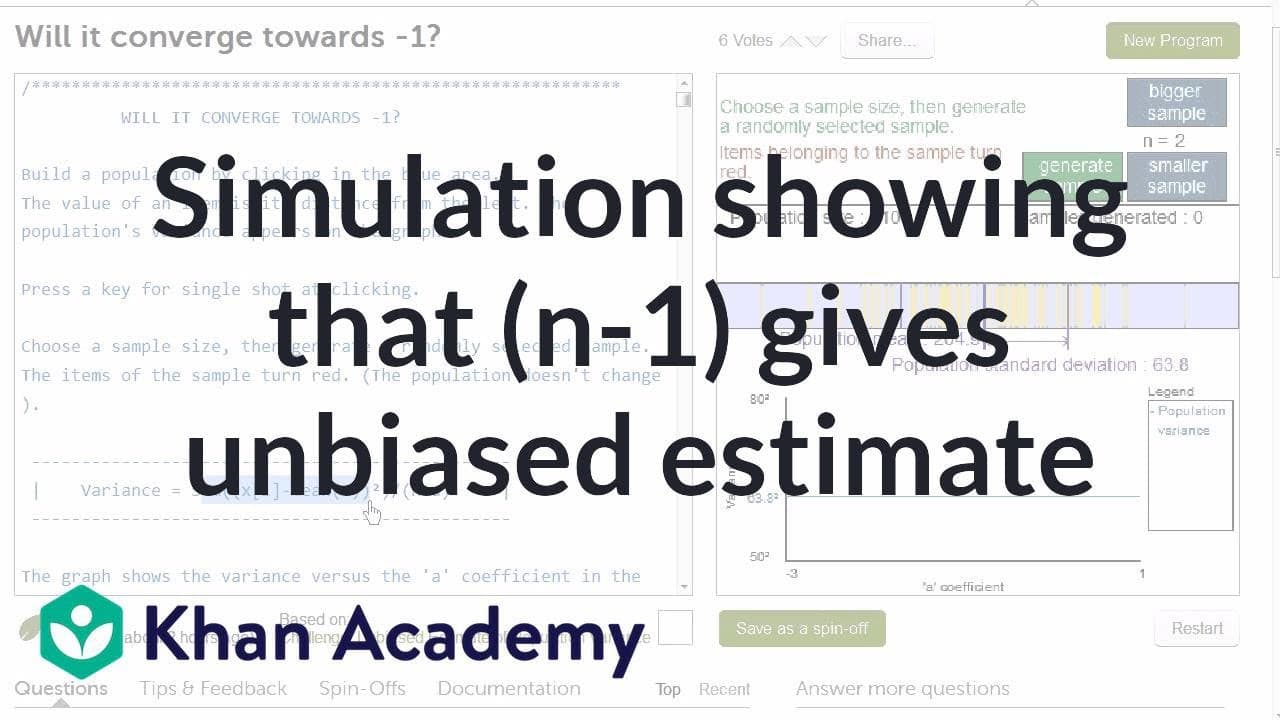
Dividing by n−1 gives the best unbiased estimate of population variance because averages across many generated samples converge on a divisor corresponding to a = −1 in n + a. In Khan Academy user TETF’s simulation, dividing by n tends to underestimate variance, while smaller divisors such as n−1.05 or n−1.5 tend to overestimate it. Read on to see how population construction, sample size, and repeated sampling reveal this pattern.
Transcript
Here's a simulation created by Khan Academy user TETF. I can assume that's pronounced tet f. And what it allows us to do is give us an intuition as to why we divide by n minus 1 when we calculate our sample variance and why that gives us an unbiased estimate of population variance. So the way this starts off, and I encourage you to go try this out ... Read More
Key Insights
- 🗂️ The simulation helps understand why we divide by n-1 in sample variance calculation.
- 👷 Constructing a population distribution and taking samples of different sizes demonstrates the impact of the divisor on variance estimation.
- 👋 Dividing by n-1 yields the best estimate for population variance.
- 🗂️ Dividing by n or values less than n-1 results in underestimation or overestimation of the population variance.
- 💨 The simulation provides an intuitive way to grasp the concept of degrees of freedom in statistics.
- 🚨 By generating multiple samples and averaging their variances, the unbiased estimate emerges.
- ❓ The simulation can be used to explore the effects of sample size and divisor choice on variance estimation.
Install to Summarize YouTube Videos and Get Transcripts
Explore YouTube Video Summarizer or Get YouTube Transcript Extractor
Questions & Answers
Q: Why does dividing by n−1 give an unbiased estimate of population variance?
The simulation repeatedly draws samples, calculates variance using different divisors, and averages the results for each divisor. Across many samples, the best estimate of population variance appears when the divisor is n + (−1), or n−1.
Q: How does TETF’s Khan Academy simulation demonstrate the n−1 rule?
Users first construct a population and then generate samples from it. The simulation compares average variance estimates produced by divisors of the form n + a, showing that the best estimate settles near a = −1.
Q: How is variance calculated for each sample in the simulation?
The numerator is the sum of the squared differences between each sampled data point and the sample mean. The simulation then divides that numerator by n + a while varying a to compare the resulting estimates.
Q: What happens when the simulation averages results from many samples?
A single sample produces a curve that is not very meaningful by itself. After many samples are generated and their variance curves are averaged, the estimate closest to the population variance occurs near a = −1.
Q: What happens when sample variance is divided by n instead of n−1?
The simulation shows that dividing by n, corresponding to a = 0, tends to underestimate the population variance. Values such as n + 0.05 also produce underestimation.
Q: What happens when the divisor is smaller than n−1?
Divisors such as n−1.05 or n−1.5 tend to overestimate the population variance in the simulation. The best estimate lies near n−1, between the divisors that produce overestimation and those that produce underestimation.
Q: Does the n−1 result hold for different sample sizes?
The demonstration begins with samples of size 2 and later uses a sample size of 6. In both cases, generating and averaging more samples makes the best divisor appear close to n−1.
Q: What population statistics does the simulation calculate?
As the example population is constructed, the simulation calculates its mean, standard deviation, and variance. In the demonstrated population, the mean is 204.09 and the standard deviation is 63.8, so the population variance is represented as 63.8 squared.
Summary & Key Takeaways
-
The simulation allows users to construct a population distribution and calculate its parameters, such as mean and standard deviation.
-
Users can then take samples of different sizes and calculate the variances.
-
Through the simulation, it becomes evident that dividing by n-1 gives the best estimate for population variance.
Read in Other Languages (beta)
Share This Summary 📚
Summarize YouTube Videos and Get Video Transcripts with 1-Click
Try YouTube Summary with ChatGPT & Claude or YouTube Transcript Generator
Explore More Summaries from Khan Academy 📚



Summarize YouTube Videos and Get Video Transcripts with 1-Click
Try YouTube Summary with ChatGPT & Claude or YouTube Transcript Generator