How Do You Find the Probability for a Sampling Distribution of the Difference in Sample Proportions?
TL;DR
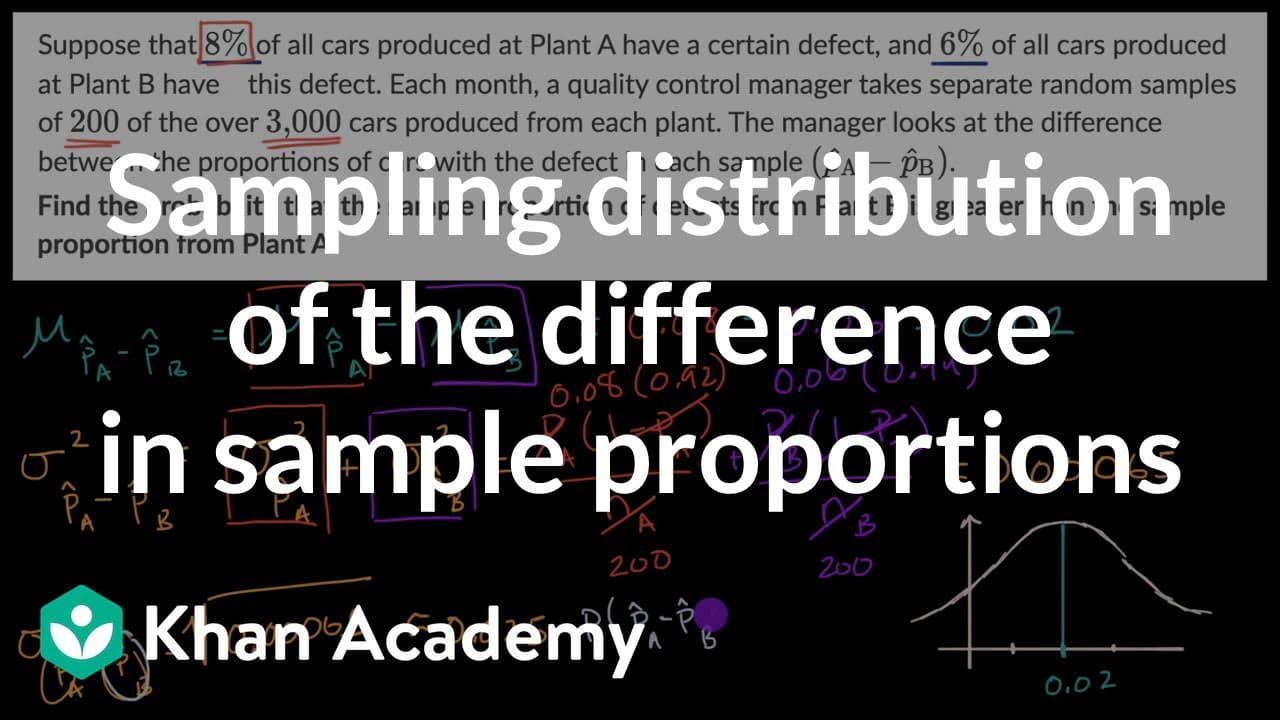
The probability that Plant B’s sample proportion of defects is greater than Plant A’s is approximately 21%. Reframe the event as the probability that Plant A’s proportion minus Plant B’s is less than zero, calculate Z as −0.02 divided by 0.025 to get approximately −0.8, and use a Z lookup table to find 0.21. Read on to see why the subtraction order and table interpretation matter.
Transcript
- [Instructor] In a previous video, we explored the sampling distribution that we got when we took the difference between sample proportions. And in that video, we described the distribution in terms of its mean, standard deviation, and shape. What we're going to do in this video is build on that example and try to answer a little bit more about it... Read More
Key Insights
- 🏛️ The video builds upon previous knowledge about sampling distribution and explores the probability comparison of sample proportions.
- 🖼️ By framing the problem as finding the probability of the difference in sample proportions being less than zero, it becomes easier to calculate.
- 🤪 Z-values and a Z lookup table are used to determine the area under the normal curve and find the desired probability.
Install to Summarize YouTube Videos and Get Transcripts
Explore YouTube Video Summarizer or Get YouTube Transcript Extractor
Questions & Answers
Q: What is the probability that Plant B’s sample proportion of defects is greater than Plant A’s?
The probability is approximately 0.21, or 21%. The instructor describes this as roughly one in five.
Q: How do you express Plant B’s sample defect proportion being greater than Plant A’s?
Express the event as Plant A’s sample proportion minus Plant B’s sample proportion being less than zero. If Plant B’s proportion is greater, subtracting it from Plant A’s produces a negative difference.
Q: What area under the sampling distribution represents the desired probability?
It is the area where the difference between Plant A’s and Plant B’s sample proportions is less than zero. On the distribution, this is the area up to and including zero.
Q: How is the Z-value calculated in this probability example?
The value zero is 0.02 to the left of the mean, so the numerator is −0.02. Dividing −0.02 by the standard deviation of 0.025 gives a Z-value of approximately −0.8.
Q: Why is the Z-value negative?
The target value is to the left of the sampling distribution’s mean. Because it is 0.02 below the mean, its standardized position is approximately −0.8.
Q: How is the Z lookup table used after calculating Z?
Look up the entry for Z = −0.8 with zeros after it. The table gives the area under the normal curve up to and including that Z-value as 0.21.
Q: Why is the result described as approximate?
The Z-value is approximately −0.8 because the standard deviation of 0.025 was itself obtained approximately in the earlier work. Therefore, the resulting probability is also reported as approximately 0.21, or 21%.
Q: What information about the sampling distribution is needed for this calculation?
The calculation builds on the sampling distribution’s mean, standard deviation, and shape. In this example, the distance from the mean is −0.02 and the standard deviation is 0.025, allowing the position to be converted into a Z-value.
Summary & Key Takeaways
-
The video discusses finding the probability of the sample proportion of defects from Plant B being greater than the sample proportion from Plant A.
-
By calculating the difference in sample proportions, the problem is transformed to finding the probability of the difference being less than zero.
-
To solve this, the video explains how to use Z-values and a Z lookup table.
Read in Other Languages (beta)
Share This Summary 📚
Summarize YouTube Videos and Get Video Transcripts with 1-Click
Try YouTube Summary with ChatGPT & Claude or YouTube Transcript Generator
Explore More Summaries from Khan Academy 📚


Summarize YouTube Videos and Get Video Transcripts with 1-Click
Try YouTube Summary with ChatGPT & Claude or YouTube Transcript Generator