Normal Distribution: Calculating Probabilities/Areas (z-table)
TL;DR
Learn how to use standard normal tables to calculate probabilities in a normal distribution.
Transcript
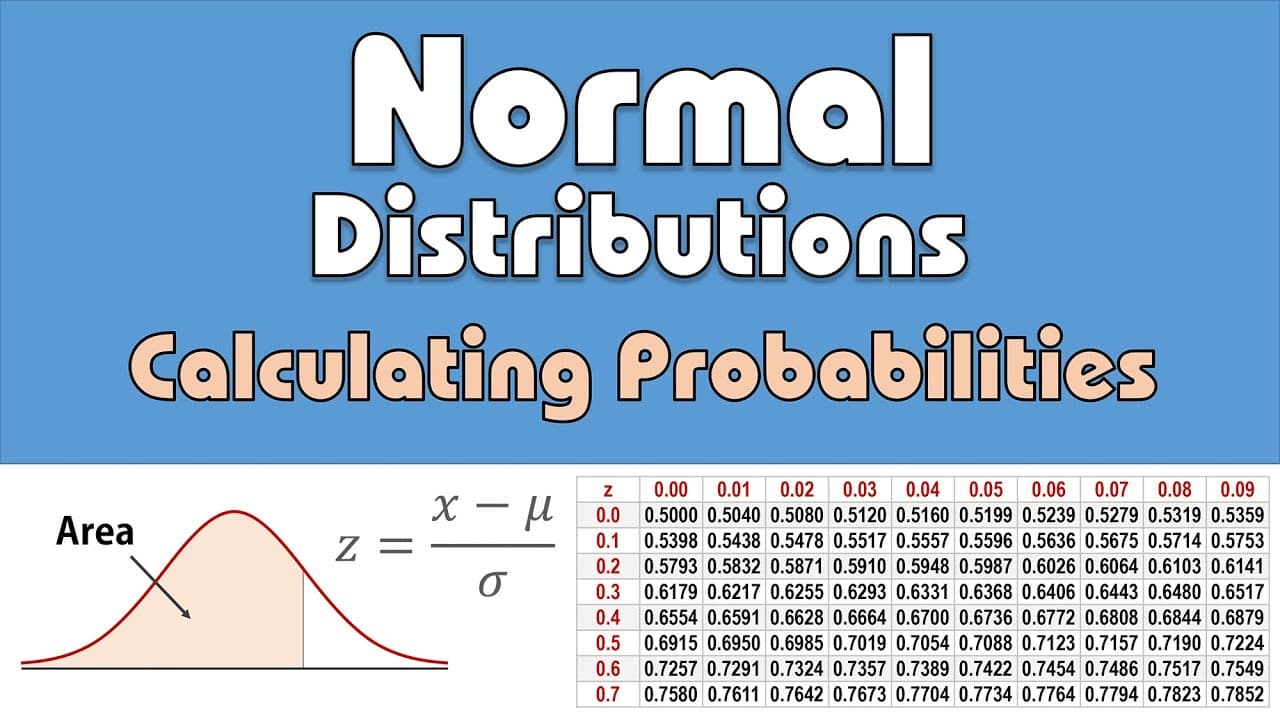
Welcome! In this video, I’ll be showing how to use the standard normal tables to calculate the probabilities in a normal distribution. A normal distribution is a symmetric, bell-shaped distribution where the area under the normal curve is 1 or 100%. The standard normal distribution, or what is also called the z distribution, is a special normal dis... Read More
Key Insights
- ❓ The standard normal distribution has a mean of 0 and standard deviation of 1.
- 💯 The z-score measures the number of standard deviations a score is from the mean.
- 🤪 Standard normal tables provide the areas under the curve for specific z-scores.
- 🚰 The tables are used to calculate probabilities in a normal distribution.
- 💯 To find the probability "less than" a score, look up the area from the table.
- 💯 To find the probability "greater than" a score, subtract the area from 1.
- 💯 To find the probability "between" two scores, subtract the smaller area from the larger area.
Install to Summarize YouTube Videos and Get Transcripts
Explore YouTube Video Summarizer or Get YouTube Transcript Extractor
Questions & Answers
Q: What is a normal distribution?
A normal distribution is a bell-shaped distribution where the majority of data falls near the mean, and the distribution is symmetric.
Q: How do you calculate the z-score?
The z-score can be calculated using the formula z=(x-μ)/σ, where x is the score, μ is the mean, and σ is the standard deviation.
Q: How do you use the standard normal tables?
To use the standard normal tables, find the z-score in the table and look up the corresponding area. The tables usually provide the area to the left of the z-score.
Q: How do you calculate probabilities for different scenarios?
To calculate probabilities for scenarios like "less than," "greater than," or "between," use the appropriate method and formula mentioned in the video. Convert scores to z-scores and find the corresponding areas in the tables.
Key Insights:
- The standard normal distribution has a mean of 0 and standard deviation of 1.
- The z-score measures the number of standard deviations a score is from the mean.
- Standard normal tables provide the areas under the curve for specific z-scores.
- The tables are used to calculate probabilities in a normal distribution.
- To find the probability "less than" a score, look up the area from the table.
- To find the probability "greater than" a score, subtract the area from 1.
- To find the probability "between" two scores, subtract the smaller area from the larger area.
- The values in the tables are rounded to two decimal places.
Summary & Key Takeaways
-
A normal distribution is a bell-shaped distribution where the area under the curve is 1.
-
The standard normal distribution (z distribution) has a mean of 0 and standard deviation of 1.
-
To calculate probabilities, convert scores to z-scores using the formula z=(x-μ)/σ, and use the standard normal tables to find the corresponding areas.
Read in Other Languages (beta)
Share This Summary 📚
Summarize YouTube Videos and Get Video Transcripts with 1-Click
Try YouTube Summary with ChatGPT & Claude or YouTube Transcript Generator
Explore More Summaries from Joshua Emmanuel 📚
Summarize YouTube Videos and Get Video Transcripts with 1-Click
Try YouTube Summary with ChatGPT & Claude or YouTube Transcript Generator