What Is Multi-Dimensional Scaling (MDS) in R?
TL;DR
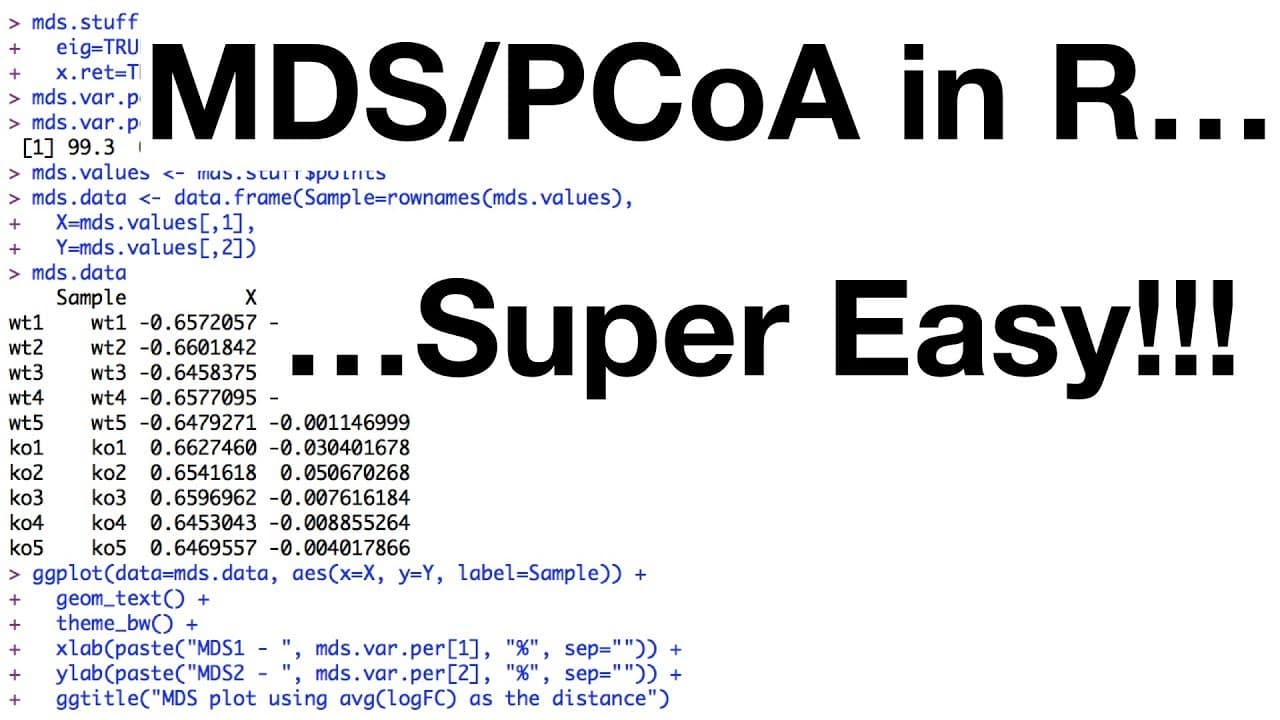
Multi-dimensional scaling (MDS) visualizes relationships in high-dimensional data by creating a distance matrix, which can be calculated using various metrics. In R, MDS is typically performed using the CMD scale function. The choice of distance metric impacts the interpretation and representation of data, as shown by comparing MDS plots generated from different metrics.
Transcript
stack west on a Monday makes for a fun day stack west on any day makes that day fun hello I'm Josh Dharma and welcome to stack west today we're going to talk about doing multi-dimensional scaling mb/s and principle coordinate analysis PCO a in r if you don't already know MDS or classical or metric MDS is the exact same thing as PCO a one last thing... Read More
Key Insights
- 😒 MDS and PCA are similar techniques but use different distance metrics for data representation.
- 😀 CMD scale function is used in R for classic MDS computation and eigenvalue calculation.
- 🎚️ Comparing MDS plots with different distance metrics can show varying levels of variation accounted for.
- ⚖️ Preparation of data involves creating a distance matrix and scaling measurements for MDS.
- 😥 MDS plots visually represent relationships between data points based on chosen distance metrics.
- 📈 The choice of distance metric in MDS can affect the interpretation of data relationships.
- 😀 MDS plots in R can be generated using ggplot for visualization.
Install to Summarize YouTube Videos and Get Transcripts
Explore YouTube Video Summarizer or Get YouTube Transcript Extractor
Questions & Answers
Q: What is the difference between MDS and PCA?
MDS and PCA are both dimensionality reduction techniques, but they use different distance metrics to represent similarities between data points. MDS focuses on preserving pairwise distances, while PCA focuses on maximizing variance.
Q: How is the data prepared for MDS in R?
In R, the data for MDS is prepared by creating a distance matrix using the dist function, transposing the matrix, centering, and scaling the measurements for each gene. This distance matrix is then used for multi-dimensional scaling.
Q: How do you interpret the MDS plot in R?
In the MDS plot in R, the position of points represents the relationships between data points based on the chosen distance metric. The axes represent the variation in the data that each axis accounts for, similar to PCA plots.
Q: What is the significance of using different distance metrics in MDS?
Using different distance metrics in MDS can result in different representations of data relationships. For example, Euclidean distance may emphasize different aspects compared to the average of the absolute value of the log fold change, impacting the interpretation of the plot.
Summary & Key Takeaways
-
Introduces MDS and PCO a, similar to PCA but with different distance metrics.
-
Shows how to generate fake data and perform MDS on it using CMD scale function.
-
Compares MDS plots using different distance metrics and explains the variation they account for.
Read in Other Languages (beta)
Share This Summary 📚
Summarize YouTube Videos and Get Video Transcripts with 1-Click
Try YouTube Summary with ChatGPT & Claude or YouTube Transcript Generator
Explore More Summaries from StatQuest with Josh Starmer 📚


Summarize YouTube Videos and Get Video Transcripts with 1-Click
Try YouTube Summary with ChatGPT & Claude or YouTube Transcript Generator