Products
Features
YouTube Video Summarizer
Summarize YouTube videos
Web & PDF Highlighter
Highlight web pages & PDFs
Chat with PDF
Ask any PDF questions with AI
Ask AI Clone
Chat with your highlights & memories
Audio Transcriber
Transcribe audio files to text
Glasp Reader
Read and highlight articles
Kindle Highlight Export
Export your Kindle highlights
Idea Hatch
Hatch ideas from your highlights
Integrations
Obsidian Plugin
Notion Integration
Pocket Integration
Instapaper Integration
Medium Integration
Readwise Integration
Snipd Integration
Hypothesis Integration
Apps & Extensions
Chrome Extension
Safari Extension
Edge Add-ons
Firefox Add-ons
iOS App
Android App
Discover
Discover
Ideas
Discover new ideas and insights
Articles
Curated articles and insights
Books
Book recommendations by great minds
Posts
Essays and notes from readers
Quotes
Inspiring quotes collection
Videos
Curated videos and summaries
Explore Glasp
Glasp Newsletter
Weekly insights and updates
Glasp Talk
Interview series with great minds
Glasp Blog
Latest news and articles
Glasp Use Cases
Learn how others use Glasp
Build & Support
Glasp API
Access Glasp's API for developers
MCP Connector
Connect Glasp to Claude & ChatGPT
Community
Glasp Reddit Community
Students
Student discount and benefits
FAQs
Frequently Asked Questions
AboutPricing
DashboardLog inSign up

Sect 4 3 #6

1.1K views
•
January 24, 2015
by
blackpenredpen
YouTube video player
Sect 4 3 #6

TL;DR

Understanding graph behavior to identify function trends through derivative analysis.

Transcript

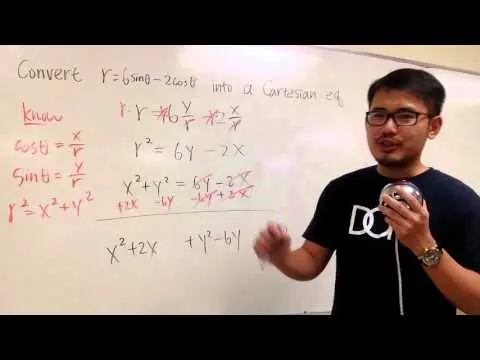
let's talk about this question we are given a graph of the first derivative and we like to answer on what interval it's the original function increasing decreasing unfortunately we not defined the graph of the original function so we can actually say for the increasing part it's a product being go up and for decreasing is the part that's been going... Read More

Key Insights

  • 📈 Derivative graph analysis aids in determining function trends like increase and decrease.
  • 😥 Local extrema are identified at points where the derivative changes sign.
  • ☺️ Paying attention to signs above and below the x-axis is crucial in interpreting derivative graphs.

Install to Summarize YouTube Videos and Get Transcripts

Explore YouTube Video Summarizer or Get YouTube Transcript Extractor

Questions & Answers

Q: How can we tell if a function is increasing or decreasing from its derivative graph?

We look for positive values above the x-axis for increasing and negative values below for decreasing. Specifically, where the first derivative is positive indicates function increase.

Q: How do we identify local maxima for the original function from the derivative graph?

Local maxima correspond to points where the derivative changes from positive to negative, signifying a peak in the function. For example, X = 1 and X = 5 are local maxima in this context.

Q: Where do local minima for the original function show up on the derivative graph?

Local minima are identified where the derivative switches from negative to positive, indicating a trough in the function. In the provided context, X = 3 is the local minimum.

Q: How does understanding the graph of the derivative help in analyzing the original function's behavior?

By interpreting the derivative graph, one can pinpoint critical points like maxima, minima, and inflection points of the original function, enhancing the understanding of its behavior.

Summary & Key Takeaways

  • Analyzing graphs of derivatives helps determine function behavior.

  • Positive derivative values indicate function increase, negative for decrease.

  • Local extrema (maxima/minima) occur where derivative changes sign.


Read in Other Languages (beta)

English

Share This Summary 📚

Summarize YouTube Videos and Get Video Transcripts with 1-Click

Download browser extensions on:

Try YouTube Summary with ChatGPT & Claude or YouTube Transcript Generator

Explore More Summaries from blackpenredpen 📚

Convert a polar equation to a cartesian equation: circle! thumbnail
Convert a polar equation to a cartesian equation: circle!
blackpenredpen
Calculating Work, pumping water out of a tank, calculus 2 tutorial, application of integration thumbnail
Calculating Work, pumping water out of a tank, calculus 2 tutorial, application of integration
blackpenredpen
integral of 1/((a-x)(b-x)) thumbnail
integral of 1/((a-x)(b-x))
blackpenredpen
How to graph a side-way parabola thumbnail
How to graph a side-way parabola
blackpenredpen
Same Derivatives Implies Same Functions? thumbnail
Same Derivatives Implies Same Functions?
blackpenredpen
Precalculus challenge: can we just cancel out the sine? thumbnail
Precalculus challenge: can we just cancel out the sine?
blackpenredpen

Summarize YouTube Videos and Get Video Transcripts with 1-Click

Download browser extensions on:

Try YouTube Summary with ChatGPT & Claude or YouTube Transcript Generator

Apps & Extensions

  • Chrome Extension
  • Safari Extension
  • Edge Add-ons
  • Firefox Add-ons
  • iOS App
  • Android App

Key Features

  • YouTube Video Summarizer
  • Web & PDF Summarizer
  • Web & PDF Highlighter
  • Chat with PDF
  • Ask AI Clone
  • Audio Transcriber
  • Glasp Reader
  • Kindle Highlight Export
  • Idea Hatch

Integrations

  • Obsidian Plugin
  • Notion Integration
  • Pocket Integration
  • Instapaper Integration
  • Medium Integration
  • Readwise Integration
  • Snipd Integration
  • Hypothesis Integration

More Features

  • APIs
  • MCP Connector
  • Blog & Post
  • Embed Links
  • Image Highlight
  • Personality Test
  • Quote Shots

Company

  • About us
  • Blog
  • Community
  • FAQs
  • Job Board
  • Newsletter
  • Pricing
Terms

•

Privacy

•

Guidelines

© 2026 Glasp Inc. All rights reserved.