How to Use the Relative Strength Index (RSI) for Trading
TL;DR
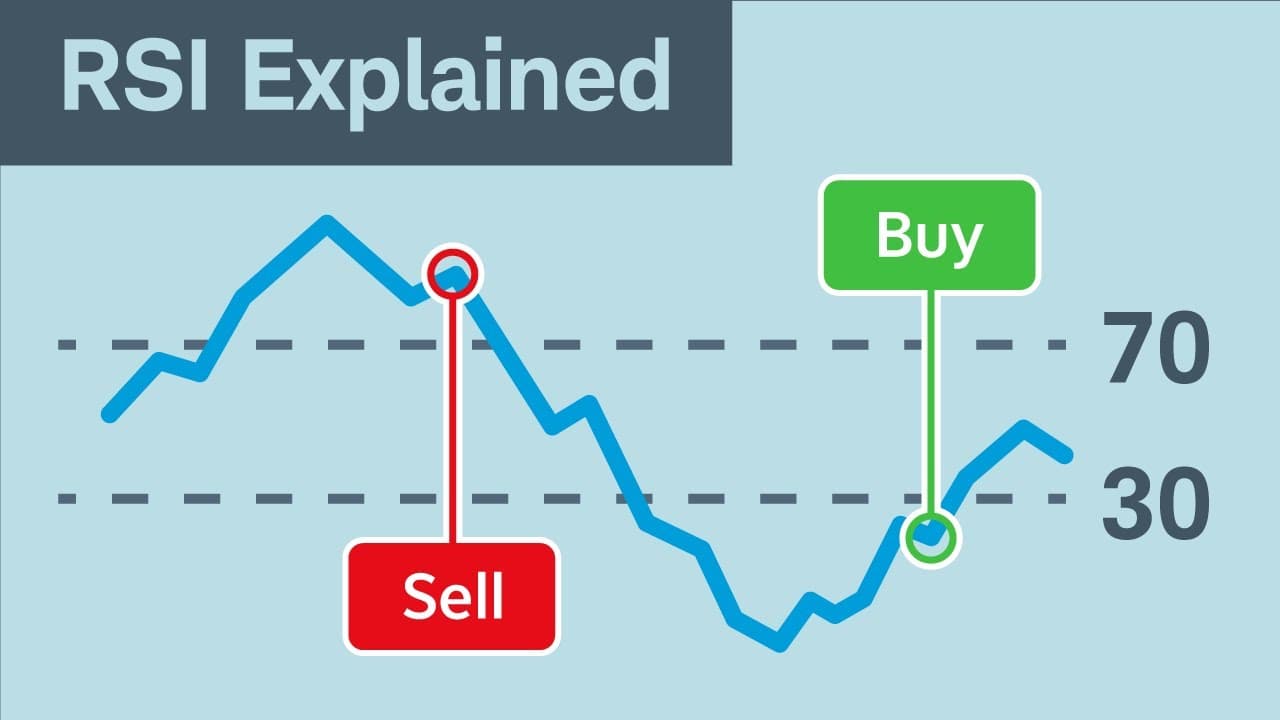
To use the Relative Strength Index (RSI), first calculate it by averaging gains and losses over a chosen period, typically 14 days. RSI values below 30 indicate oversold conditions (potential buying signals), while values above 70 suggest overbought conditions (potential selling signals). Additionally, divergences between RSI and price movements can signal potential trend reversals.
Transcript
The Relative Strength Index, or RSI, is an oscillating indicator that is designed to measure a stock’s momentum, which is both the speed and size of price changes. Many investors use this indicator to help identify whether a stock is overbought or oversold. Using this information could help determine potential entry and exit trading signals. In thi... Read More
Key Insights
- 🪚 RSI is a popular indicator used by investors to gauge a stock's momentum and identify potential entry and exit trading signals.
- 🉐 It is calculated by averaging gains and losses over a chosen time period and plotting the values on a graph.
- ❓ RSI can be used to identify overbought and oversold conditions, with values above 70 indicating overbought and values below 30 indicating oversold.
- 🤒 Divergences between RSI and stock price movements can signal potential trend reversals.
- 🤒 However, RSI signals are not foolproof and should be used in conjunction with other confirmation tools.
- 🤒 External factors and prolonged overbought or oversold conditions can affect the accuracy of RSI signals.
- 🤒 RSI reading requires subjectivity and benefit from hindsight.
Install to Summarize YouTube Videos and Get Transcripts
Explore YouTube Video Summarizer or Get YouTube Transcript Extractor
Questions & Answers
Q: How is RSI calculated?
RSI is calculated by adding up the average gains and dividing by the average losses over a chosen time period.
Q: How is RSI used to identify potential trading signals?
RSI values below 30 are considered oversold, and crossing back above 30 may generate a potential bullish entry signal. RSI values above 70 are considered overbought, and crossing back below 70 may generate a potential exit signal.
Q: How does RSI help identify potential trend reversals?
RSI can spot divergences, where a stock's price moves in one direction while RSI moves in the opposite direction. A bullish divergence suggests a bullish reversal may follow, and a bearish divergence suggests a bearish reversal. Entry and exit signals can be based on these divergences.
Q: What are the limitations of using RSI?
RSI signals aren't always accurate and can't account for external factors affecting stock prices. RSI can also stay overbought or oversold for extended periods. It's recommended to use RSI in conjunction with other confirmation tools and consider the broader market trend.
Summary & Key Takeaways
-
RSI is an oscillating indicator used to measure a stock's momentum, both in terms of speed and size of price changes.
-
It is calculated by adding up the average gains and dividing by the average losses over a chosen time period.
-
RSI values between 0 and 100 are plotted on a graph to visualize momentum in relative terms.
Read in Other Languages (beta)
Share This Summary 📚
Summarize YouTube Videos and Get Video Transcripts with 1-Click
Try YouTube Summary with ChatGPT & Claude or YouTube Transcript Generator
Explore More Summaries from Charles Schwab 📚


Summarize YouTube Videos and Get Video Transcripts with 1-Click
Try YouTube Summary with ChatGPT & Claude or YouTube Transcript Generator