Pie chart | Sports Distribution | Data Interpretation | Reasoning | Part - 20 | Bharath Kumar
TL;DR
The content explains how to interpret pie charts on sports participation by gender and solve related mathematical problems.
Transcript
hi everyone welcome to the session in this session I am continuing pie chart date and petition first of all we need to read the information carefully after that we need to solve the questions according to the given information here the information is about percentage-wise distribution of players who play five different sports who play five differen... Read More
Key Insights
- 🥧 The analysis focuses on two pie charts that represent gender distributions in sports, providing a basis for understanding data interpretation.
- 🥳 Statistical formulas such as averages, differences, and ratios are crucial for extracting meaningful insights from percentage data.
- 👻 Understanding how to derive male player counts from subtraction allows for efficient calculations in sports statistics.
- 🥧 Familiarity with given data (total counts and percentages) is essential in accurately interpreting pie charts and answering related questions.
- 🫵 The session emphasizes a structured approach to problem-solving, helping viewers learn to tackle similar statistical problems independently.
- 💦 Knowledge of basic percentage calculations is vital for anyone looking to work with sports participation data effectively.
- ⌛ The conclusion underscores that while the problem-solving process may be time-consuming, it becomes easier with practice and familiarity.
Install to Summarize YouTube Videos and Get Transcripts
Explore YouTube Video Summarizer or Get YouTube Transcript Extractor
Questions & Answers
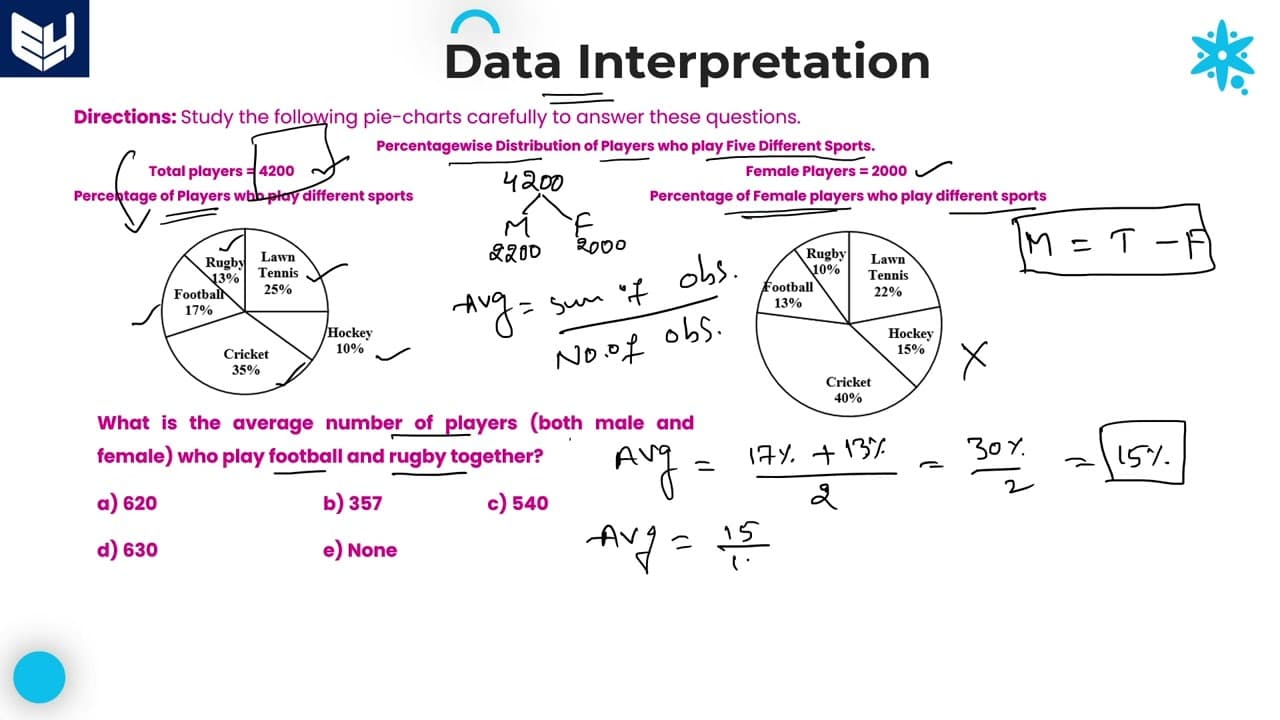
Q: What is the average number of players participating in football and rugby?
The average number of players participating in football and rugby can be calculated by averaging their percentages from the pie chart—17% for football and 13% for rugby. This results in an average of 15%. To find the actual number of players, we calculate 15% of the total 4,200 players, resulting in 630 players participating in both sports.
Q: How do you calculate the number of male players in a specific sport?
To find the number of male players in a specific sport, first, determine the total percentage of players for that sport. From this total, deduct the number of female players in that sport, obtained by calculating the percentage of females from the overall female count of 2,000. For example, for rugby, the total male players are derived from subtracting female counts from the overall totals.
Q: What is the ratio of female players in cricket to male players in hockey?
The ratio can be found by calculating the female players in cricket, which is 40% of the 2,000 female players (800), and the male players in hockey, deriving from the total hockey percentage of 10% (420) minus the female players' percentage. This results in 120 male hockey players; therefore, the ratio of female cricket players to male hockey players is 800:120 or simplified to 20:3.
Q: How do you approach calculating the total male players across multiple sports?
To calculate the total number of male players across multiple sports, assess each sport independently. Determine the number of players from both the total players and identify female counts for each sport, as required. By aggregating the calculated male numbers for cricket, rugby, and football, you can arrive at the final total.
Summary & Key Takeaways
-
The session discusses pie chart analysis of sports participation percentages for males and females across five sports, totaling 4,200 players.
-
It details the calculations for various statistical measures, including averages, differences, and ratios based on the data represented in two pie charts.
-
By working through specific questions, the content illustrates methodologies for extracting male and female player counts from the given percentages, enhancing understanding of statistical concepts.
Read in Other Languages (beta)
Share This Summary 📚
Summarize YouTube Videos and Get Video Transcripts with 1-Click
Try YouTube Summary with ChatGPT & Claude or YouTube Transcript Generator