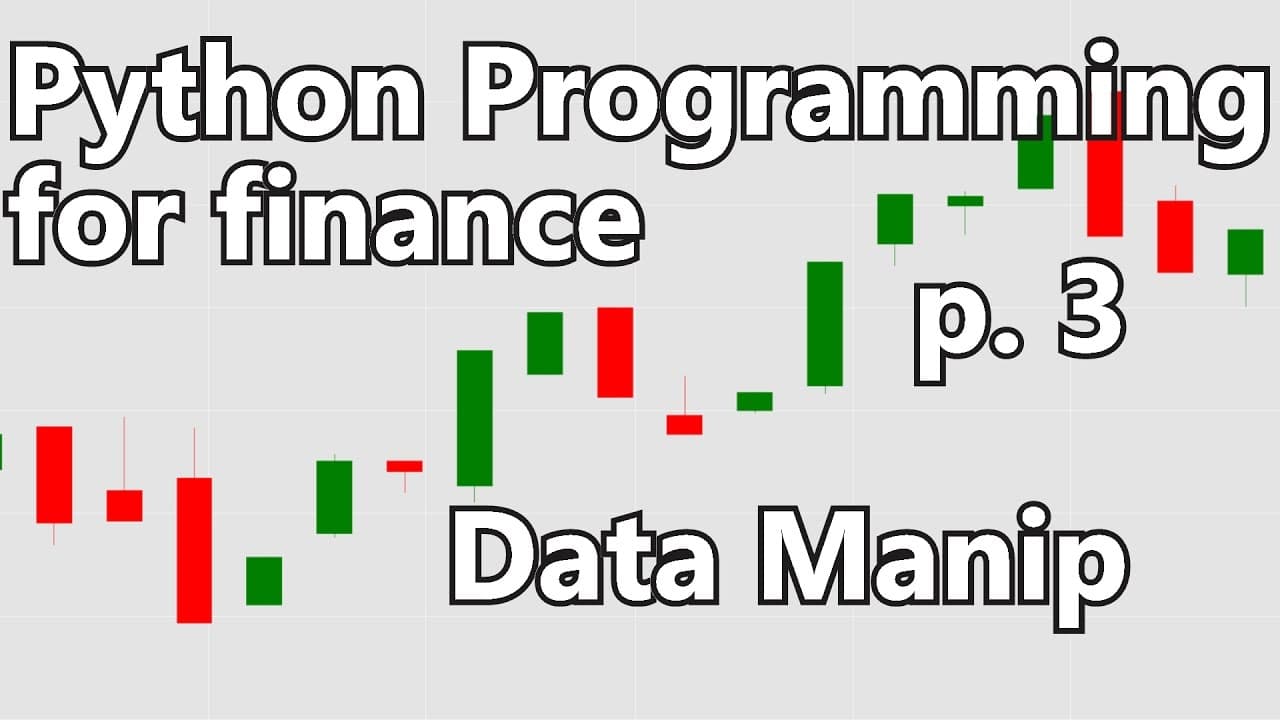
Basic Stock data Manipulation - Python Programming for Finance p.3
TL;DR
Learn how to manipulate and visualize data using pandas in Python for finance.
Transcript
what's going on everybody welcome to part three of the Python for Finance tutorial series in the previous tutorials we've talked a little bit about bringing in some data and also visualizing that data and in this tutorial we're going to talk a little bit about manipulating that data and a little bit more about visualizing that data both of them are... Read More
Key Insights
- 😒 Pandas provides easy-to-use functions for data manipulation in Python for finance tasks.
- 📈 Moving averages are useful for smoothing out price data and identifying trends in financial markets.
- 💦 Handling missing data is essential for accurate analysis and can be done through dropping or filling NaN values.
- 💦 Matplotlib is an essential library for data visualization in Python, especially when working with finance data.
- ⏳ Candlestick graphs are widely used in finance for visualizing open, high, low, and close prices over a specific time interval.
- 🐼 Resampling is a powerful technique in pandas for aggregating and transforming time series data.
- 👨💻 The video tutorial provides practical examples and code for implementing the concepts discussed.
Install to Summarize YouTube Videos and Get Transcripts
Explore YouTube Video Summarizer or Get YouTube Transcript Extractor
Questions & Answers
Q: How can we create new columns in a DataFrame using pandas?
To create new columns in a DataFrame, use the brackets notation and assign a value to the new column name. For example, df['new_column'] = values.
Q: What is a moving average and how can we calculate it using pandas?
A moving average is the average of a data series over a given period. In pandas, we can calculate it using the rolling function with the desired window size, and then applying a specific calculation (e.g., mean) using the dot notation. For example, df['moving_average'] = df['price'].rolling(window=100).mean().
Q: How can we handle missing data in a DataFrame?
Missing data can be handled by dropping rows that contain NaN values using the dropna method with the inplace=True parameter. Alternatively, we can fill NaN values with a specific value using the fillna method.
Q: How can we visualize data using matplotlib in Python for finance?
Matplotlib is a powerful library for data visualization in Python. To plot data from a DataFrame, create a figure and subplot(s) using the plt.subplots function. Then, use the plot method to create line or bar plots, providing the appropriate data series and customizing it with parameters like line color or label.
Summary & Key Takeaways
-
This tutorial focuses on manipulating and visualizing data using pandas in Python for financial analysis tasks.
-
The tutorial covers creating new columns in a DataFrame, calculating a 100-day moving average, handling missing data, and using matplotlib for data visualization.
-
The tutorial also introduces the concept of candlestick graphs and discusses their importance in finance.
Read in Other Languages (beta)
Share This Summary 📚
Summarize YouTube Videos and Get Video Transcripts with 1-Click
Try YouTube Summary with ChatGPT & Claude or YouTube Transcript Generator
Explore More Summaries from sentdex 📚


Summarize YouTube Videos and Get Video Transcripts with 1-Click
Try YouTube Summary with ChatGPT & Claude or YouTube Transcript Generator