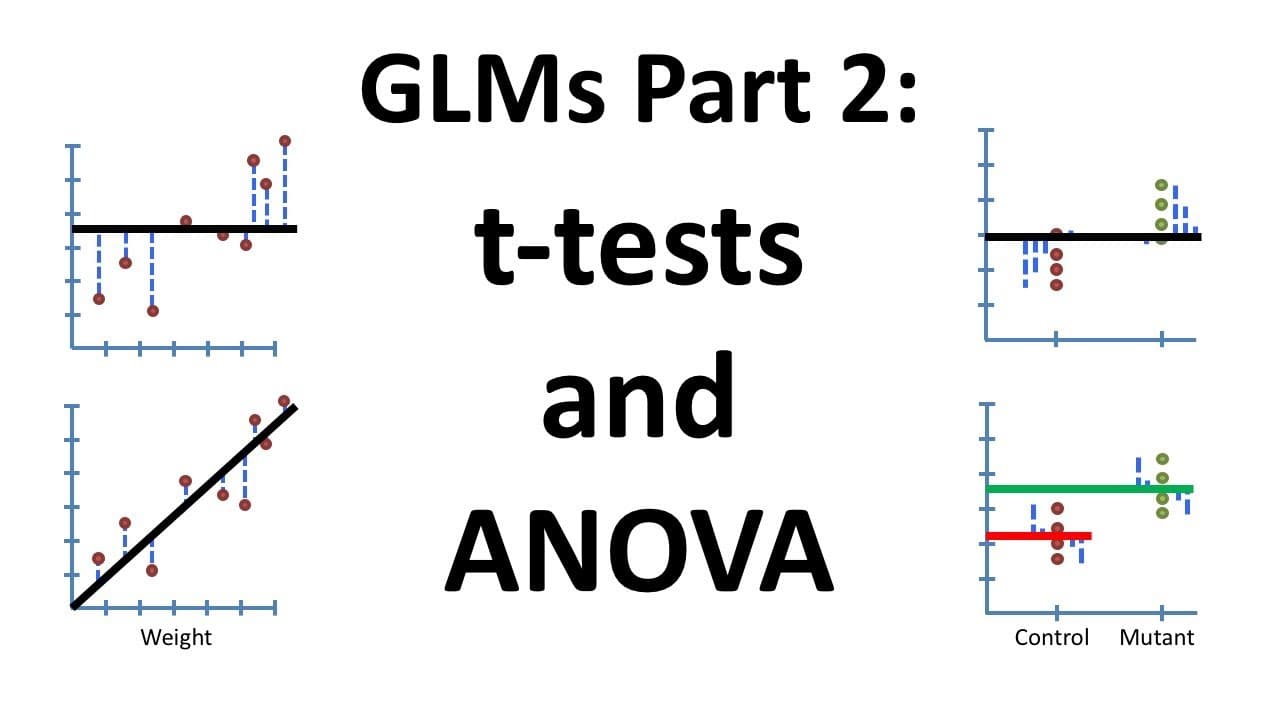
How to Use Linear Models for t-tests and ANOVA?
TL;DR
Linear models enable the application of regression techniques to perform t-tests and ANOVA by utilizing design matrices for analysis. This approach calculates p-values and assesses means across categories, facilitating statistical comparisons and reducing complexity in data analysis.
Transcript
twist step twist step twist yeah hello and welcome to stat quest stat quest was brought to you by the friendly folks in the genetics department at the University of North Carolina at Chapel Hill today we're doing part 2 of our series on general linear models last time we talked about how to do linear regression this time we're going to talk about h... Read More
Key Insights
- 🏆 Linear regression techniques can be extended to t-tests and ANOVA for statistical analysis.
- 🦻 Design matrices aid in representing parameters for different categories and simplifying calculations.
- 🫥 Comparison of mean values and fitting lines is essential for understanding variability in the data.
- 🫥 Fitting lines to data points help in determining relationships and significance between different categories.
- 😥 Calculating sum of squares of residuals provides insights into the dispersion of data points around mean values.
- ⚾ P-values are calculated based on the parameters and residuals, indicating the significance of relationships in the data.
- 🎨 Utilizing design matrices streamlines the statistical analysis process and ensures consistency in results.
Install to Summarize YouTube Videos and Get Transcripts
Explore YouTube Video Summarizer or Get YouTube Transcript Extractor
Questions & Answers
Q: How are linear regression techniques applied to t-tests and ANOVA?
Linear regression techniques are used to calculate parameters and fit lines for different categories in t-tests and ANOVA. Design matrices play a crucial role in this process, helping in statistical analysis.
Q: What is the significance of calculating sum of squares of residuals in statistical analysis?
Calculating sum of squares of residuals helps in determining the variability of data points around mean values and fitted lines, providing insights into the overall trends in the data.
Q: How do design matrices simplify the process of statistical analysis?
Design matrices act as a structured representation of parameters for different categories in the data, making it easier to calculate F-values and p-values for t-tests and ANOVA, streamlining the analysis process.
Q: Why is it important to utilize design matrices in statistical analysis?
Design matrices help in standardizing the calculations for different statistical tests, making it easier to compare results across different datasets and categories, ensuring consistency in the analysis.
Summary & Key Takeaways
-
Explanation of applying linear regression concepts to t-tests and ANOVA.
-
Use of design matrices for calculations in statistical analysis.
-
Comparison of mean values and fitting lines for different categories in the data.
Read in Other Languages (beta)
Share This Summary 📚
Summarize YouTube Videos and Get Video Transcripts with 1-Click
Try YouTube Summary with ChatGPT & Claude or YouTube Transcript Generator
Explore More Summaries from StatQuest with Josh Starmer 📚


Summarize YouTube Videos and Get Video Transcripts with 1-Click
Try YouTube Summary with ChatGPT & Claude or YouTube Transcript Generator