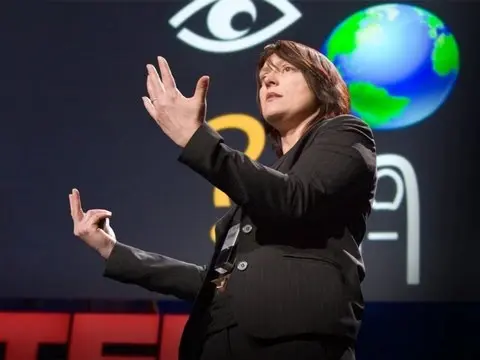
Nathalie Miebach: Art made of storms

TL;DR
A sculptor and musician translates weather data into musical scores and sculptures, challenging the boundaries between art, science, and music.
Transcript
(Music) What you just heard are the interactions of barometric pressure, wind and temperature readings that were recorded of Hurricane Noel in 2007. The musicians played off a three-dimensional graph of weather data like this. Every single bead, every single colored band, represents a weather element that can also be read as a musical note. I find ... Read More
Key Insights
- 🎵 Weather can be made visible, tactile, and audible through sculpture and music, using data from weather stations and satellite images.
- 🌊 The forms created from weather data reveal behavioral relationships that may not be apparent in a two-dimensional graph.
- 🌡️ Weather data can be translated into musical scores, allowing for a nuanced representation of information.
- 🎨 The interpretation of weather visualizations can change depending on where they are placed, challenging the viewer to reconsider the boundaries of art, science, and music.
- 📚 Weather sculpture and music offer an alternative entry point into the complexity of science, making it more accessible to those without a science background.
Install to Summarize YouTube Videos and Get Transcripts
Explore YouTube Video Summarizer or Get YouTube Transcript Extractor
Questions & Answers
Q: How does the artist create sculptures and musical scores using weather data?
The artist begins by using low-tech data collecting devices to gather information from specific environments. This data is then compared with historical and real-time data to create sculptures and musical scores. The sculptures are made up of weather elements and the musical scores translate weather data into a nuanced form of musical notation.
Q: What is the purpose of translating weather data into art and music?
The purpose is to challenge assumptions about the visual language of art, science, and music. The artist believes that this approach offers an alternative entry point into the complexity of science, allowing a wider audience to engage with and appreciate scientific concepts.
Q: How does the artist interpret and represent weather elements in their work?
The artist assigns values to vertical and horizontal elements of a basket, using the changes of these data points over time to create the form. Natural reed, with its inherent tension, is used to create the baskets, allowing the numbers to control the form. Weather elements such as high tide readings, water temperature, air temperature, and moon phases are woven into the sculpture's grid.
Q: How are the sculptures and musical scores perceived differently in different contexts?
The perception of the artwork changes depending on where it is placed. In an art museum, it is seen as a sculpture. In a science museum, it becomes a three-dimensional visualization of data. In a music hall, it is read as a musical score. This challenges viewers to question the visual language associated with art, science, and music.
Summary & Key Takeaways
-
The artist uses weather data to create sculptures and musical scores, making the invisible visible and audible.
-
Low-tech data-collecting devices are used to extract information from specific environments, which is then compared with historical and real-time data from weather stations and offshore buoys.
-
The sculptures and musical scores are made up of weather elements and reveal behavioral relationships that may not be apparent in two-dimensional graphs.
Read in Other Languages (beta)
Share This Summary 📚
Summarize YouTube Videos and Get Video Transcripts with 1-Click
Try YouTube Summary with ChatGPT & Claude or YouTube Transcript Generator
Explore More Summaries from TED 📚


Summarize YouTube Videos and Get Video Transcripts with 1-Click
Try YouTube Summary with ChatGPT & Claude or YouTube Transcript Generator