(Q8.) Sample 3 GCC Math 101/120 Common Final Intermediate Algebra

TL;DR
This content explains how to graph a quadratic equation by finding the vertex and creating a table of points.
Transcript
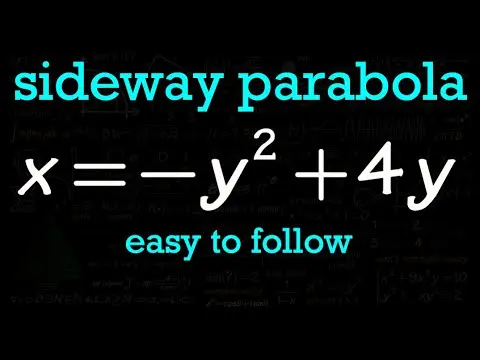
for question number 8 we are going to graph the equation y is equal to negative x squared plus 4x plus 5 and notice that this is an equation of a parabola and whenever we are trying to graph an equation for palabras what we need first is to the vertex we need to find the vertex first and for this one notice that we have the form Y is equal to ax sq... Read More
Key Insights
- ❓ The vertex formula, -B/2A, is used to find the coordinates of the vertex of a quadratic equation.
- ☺️ The coefficients of the x^2 and x terms in the equation determine the shape and direction of the parabola.
- 😥 Creating a table of points helps in accurately plotting the parabola on the graph.
Install to Summarize YouTube Videos and Get Transcripts
Explore YouTube Video Summarizer or Get YouTube Transcript Extractor
Questions & Answers
Q: How do you graph a quadratic equation?
To graph a quadratic equation, you first need to find the vertex. This can be done using the vertex formula, which is -B/2A. Once you have the vertex, you can create a table of points by plugging in neighboring x-values into the equation and solving for y.
Q: Why is the vertex important in graphing a quadratic equation?
The vertex is important because it gives us the coordinates of the highest or lowest point on the parabola. It is also used as a reference point when creating the table of points for graphing.
Q: How do you determine the shape of a parabola based on the equation?
The shape of a parabola can be determined by the coefficient of the x^2 term in the equation. If the coefficient is positive, the parabola opens upwards, and if it is negative, the parabola opens downwards.
Q: Why is it necessary to create a table of points for graphing a quadratic equation?
Creating a table of points helps us visualize the shape of the parabola and plot accurate points on the graph. It also allows us to see the symmetry of the parabola and identify any special points, such as the vertex.
Summary & Key Takeaways
-
The video explains how to graph a quadratic equation by first finding the vertex.
-
After finding the vertex, a table of points is created to plot on the graph.
-
The table includes the vertex and its neighboring numbers, with corresponding y-values found by plugging in the x-values into the equation.
Read in Other Languages (beta)
Share This Summary 📚
Summarize YouTube Videos and Get Video Transcripts with 1-Click
Try YouTube Summary with ChatGPT & Claude or YouTube Transcript Generator
Explore More Summaries from blackpenredpen 📚


Summarize YouTube Videos and Get Video Transcripts with 1-Click
Try YouTube Summary with ChatGPT & Claude or YouTube Transcript Generator