Deviance Residuals
TL;DR
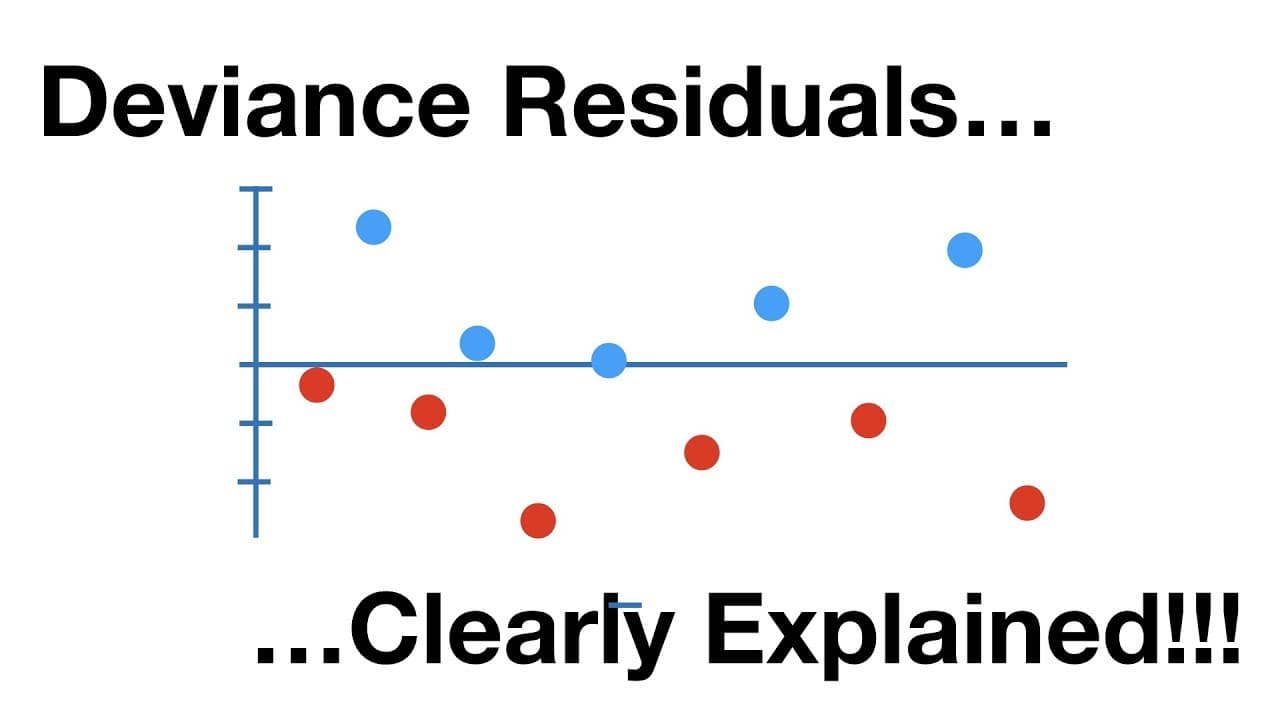
Deviance residuals pinpoint outliers in statistical models through distances from the best-fit line.
Transcript
if I was a cat I'd be sleeping on the couch but I'm not a cat so I'm watching stat quest stat quest hello I'm Josh stormer and welcome to stat quest today we're going to talk about deviance residuals and they're gonna be clearly explained this stat quest follows up on the stat quest on saturated models and deviant statistics so watch that video fir... Read More
Key Insights
- 😥 Deviance residuals are calculated as the square root of the difference in log likelihoods for individual data points.
- 😥 They help identify outliers by quantifying the contribution of each data point to the overall residual deviance.
- 🫥 In logistic regression, deviance residuals aid in assessing model fit by evaluating distances from the best-fitting line.
- 🫥 Deviance residuals can be positive (above the line) or negative (below the line) based on their distance from the best fit.
- 🧑🌾 Outliers can be identified by deviance residuals that are significantly far from zero.
- 🫥 Comparison of deviance residuals with the best-fitting line helps in understanding the model's accuracy and potential error points.
- 🖐️ Deviance residuals play a crucial role in statistical analysis by aiding in model evaluation and outlier detection.
Install to Summarize YouTube Videos and Get Transcripts
Explore YouTube Video Summarizer or Get YouTube Transcript Extractor
Questions & Answers
Q: What is the formula for calculating deviance residuals?
Deviance residuals are calculated as the square root of the difference in log likelihoods for each data point, aiding in outlier identification in statistical models.
Q: How do deviance residuals help assess model fit?
Deviance residuals quantify the contribution of each data point to the overall residual deviance, allowing the identification of outliers that may impact model accuracy.
Q: Why are deviance residuals analogous to residuals in ordinary least squares?
Deviance residuals are akin to residuals in ordinary least squares as they represent the variation in likelihoods for individual data points, aiding in model evaluation and outlier detection.
Q: How do deviance residuals assist in logistic regression?
In logistic regression, deviance residuals highlight the distances between data points and the best-fitting line, enabling the identification of outliers that may skew model predictions.
Summary & Key Takeaways
-
Deviance residuals are calculated as the difference in log likelihoods for individual data points.
-
They represent the contribution of each data point to the overall residual deviance.
-
They help identify outliers by comparing distances from the best-fitting line.
Read in Other Languages (beta)
Share This Summary 📚
Summarize YouTube Videos and Get Video Transcripts with 1-Click
Try YouTube Summary with ChatGPT & Claude or YouTube Transcript Generator
Explore More Summaries from StatQuest with Josh Starmer 📚


Summarize YouTube Videos and Get Video Transcripts with 1-Click
Try YouTube Summary with ChatGPT & Claude or YouTube Transcript Generator