A Technical Look At The VIX and Nasdaq

TL;DR
Technical analysis indicates support levels for Dow Jones and S&P 500, while VIX appears stagnant. Nasdaq shows potential weakness.
Transcript
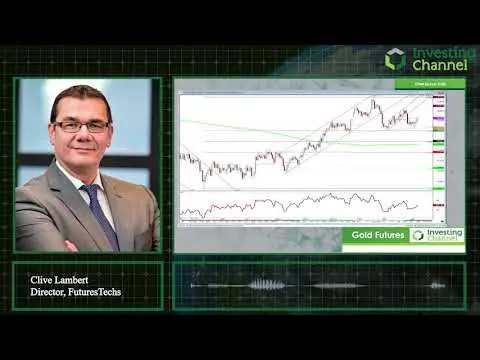
in this section I'm going to cover the Dow Jones the S&P 500 the VIX and the Nasdaq all from a technical perspective let's kick off with the Dow Jones very interesting that we're trading above the 50-day and 200-day moving average what's particularly interesting is the 50-day is cutting up through the 200-day now that would be a golden bicycle or g... Read More
Key Insights
- 😵 The Dow Jones shows positive technical signals with support levels, despite not adhering to a textbook golden cross pattern.
- 🤩 The S&P 500 remains above key moving averages, indicating a bullish outlook.
- 🖤 The VIX index is stagnant and lacks any significant movement or momentum.
- 🤩 The Nasdaq displays potential weakness with a bearish pattern and trading below key moving averages.
- 👋 Regional banks are experiencing sharp declines, while the IT sector is the best performing sector of the year.
Install to Summarize YouTube Videos and Get Transcripts
Explore YouTube Video Summarizer or Get YouTube Transcript Extractor
Questions & Answers
Q: What is the significance of the Dow Jones trading above the 50-day and 200-day moving averages?
When the Dow Jones is above both moving averages, it suggests a positive trend and potential support. However, since the 200-day moving average is flatlining, it may not be a perfect bullish signal.
Q: Is the lower high in place a concern for the Dow Jones?
While a lower high can indicate potential weakness, the presence of the moving averages should act as support for the market and prevent a significant decline.
Q: What is the current outlook for the S&P 500 based on technical analysis?
The S&P 500 remains above key moving averages, with the 50-day moving average expected to cut through the 200-day moving average. This is generally considered a bullish signal.
Q: How is the VIX index performing in relation to the current market conditions?
The VIX index appears to be stuck within its longer-term moving averages, suggesting a lack of volatility or significant changes. The market seems dull from a VIX perspective.
Summary & Key Takeaways
-
Dow Jones is trading above the 50-day and 200-day moving averages, with potential support areas and a positive outlook.
-
S&P 500 experienced a corrective dip to a support area at 2,800, but remains above key moving averages.
-
VIX appears to be in a stagnant market, with no significant changes in momentum or movement.
-
Nasdaq shows potential weakness, with a pattern resembling a bearish trend and trading below key moving averages.
Read in Other Languages (beta)
Share This Summary 📚
Summarize YouTube Videos and Get Video Transcripts with 1-Click
Try YouTube Summary with ChatGPT & Claude or YouTube Transcript Generator
Explore More Summaries from InvestingChannel 📚
Summarize YouTube Videos and Get Video Transcripts with 1-Click
Try YouTube Summary with ChatGPT & Claude or YouTube Transcript Generator