How to Graph Parametric Equations and Eliminate t
TL;DR
To graph parametric equations, create a table of values for t, x, and y, then plot the points on a graph, indicating the direction of the curve with arrows from low t to high t values. Eliminating the parameter t involves solving one equation for t and substituting it into another to express x or y in terms of the other variable.
Transcript
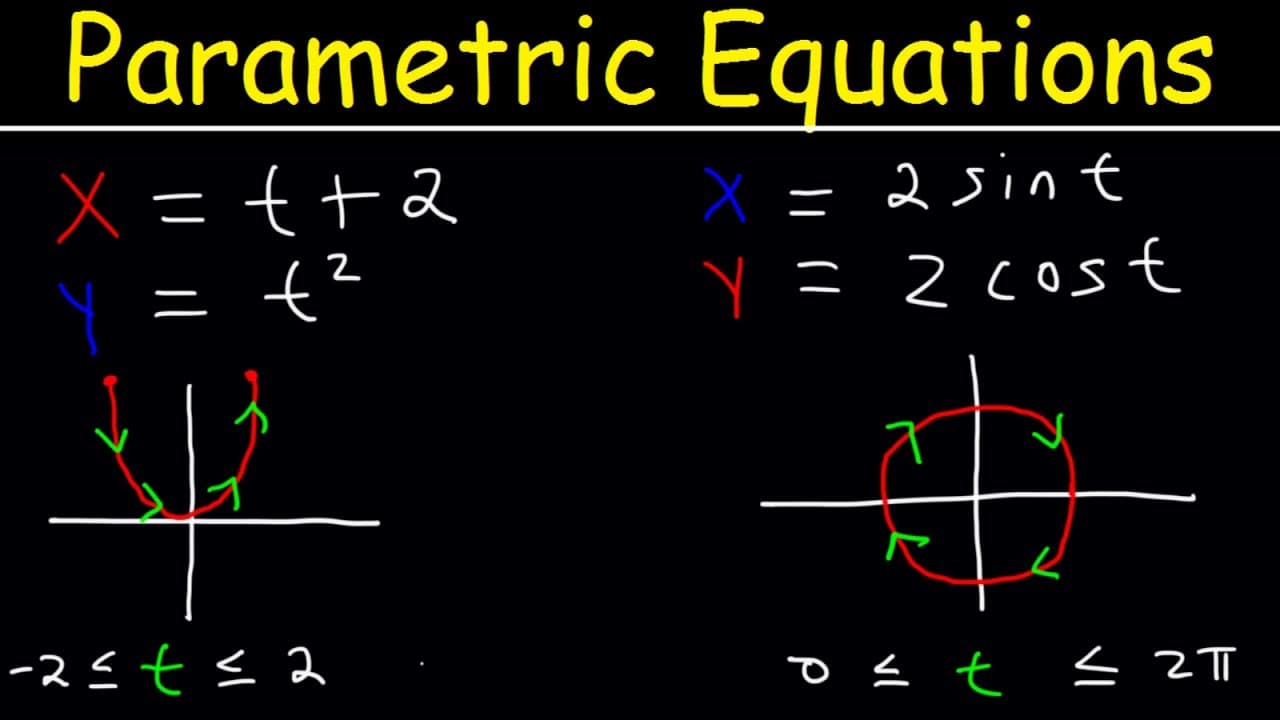
in this video we're going to focus on graphing parametric equations and also we're going to talk about eliminating the parameter so let's say that x is equal to t plus 2 and also y let's say that's equal to t squared and t is between negative two and positive two so the best way to graph this particular equations is to make a table with three varia... Read More
Key Insights
- ❣️ Graphing parametric equations involves creating a table of t, x, and y values, and plotting the corresponding points on a graph.
- ↘️ Arrows indicating the direction of the curve are drawn from a low t value to a high t value.
- 🍉 Eliminating the parameter involves solving one of the equations for t and substituting it into the other equation to express one variable in terms of the other.
- 📈 Proper understanding of trigonometric functions and logarithms is helpful in graphing certain parametric equations.
Install to Summarize YouTube Videos and Get Transcripts
Explore YouTube Video Summarizer or Get YouTube Transcript Extractor
Questions & Answers
Q: What is the process for graphing parametric equations?
To graph parametric equations, create a table with t, x, and y values. Substitute each t value into the equations to find the corresponding x and y values, then plot the points on a graph. Connect the points and indicate the direction of the curve.
Q: How can you eliminate the parameter in a parametric equation?
To eliminate the parameter, solve one of the equations for t and substitute it into the other equation. This way, you can express one variable (x or y) in terms of the other, allowing you to graph the equation using only x and y.
Q: What is the significance of the directional arrows in the graph?
The directional arrows indicate the direction in which the curve of the graph is moving. They are drawn from a low t value towards a high t value. The arrows help visualize the shape and direction of the parametric equation on the graph.
Q: How do you graph an equation after eliminating the parameter?
After eliminating the parameter, the resulting equation is in terms of x and y. Plot the points obtained from the equation on a graph, connecting them to form the graph. Consider any restrictions on the domain or range of the equation.
Summary & Key Takeaways
-
The video discusses how to graph parametric equations by creating a table of values for x and y based on different t values.
-
It demonstrates graphing examples using parametric equations and explains the directional arrows in the graph.
-
The video also explains how to eliminate the parameter t by solving for x or y in terms of t, in order to graph the equation in terms of x and y.
Read in Other Languages (beta)
Share This Summary 📚
Summarize YouTube Videos and Get Video Transcripts with 1-Click
Try YouTube Summary with ChatGPT & Claude or YouTube Transcript Generator
Explore More Summaries from The Organic Chemistry Tutor 📚


Summarize YouTube Videos and Get Video Transcripts with 1-Click
Try YouTube Summary with ChatGPT & Claude or YouTube Transcript Generator