Futures Technical Deep Dive - 3/29

TL;DR
Gold faced a setback and may test the support level at $1280, Crude Oil is experiencing support-turned-resistance and is expected to break above $61.70, Equity markets face downside risk unless they surpass the resistance level at $2833, and Euro/USD is likely to test the support level at $111.76.
Transcript
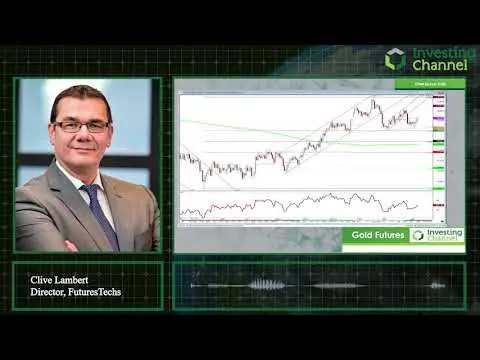
hello there it's Clyde Lambert here from futures texts and gonna take a look at a few major markets and the the charts today and let's get cracking and make the first one I want to look at is gold I looked at gold on the same segment last week and I said that because we bounced from a low of of 1280 sometime around the the the rim was it actually w... Read More
Key Insights
- 🍳 Gold broke out of its channel and may revisit the support level at $1280.
- 💁 Crude Oil has formed a support-turned-resistance level and is expected to break above $61.70.
- 😀 Equity markets face downside risk unless they surpass the resistance level at $2833.
Install to Summarize YouTube Videos and Get Transcripts
Explore YouTube Video Summarizer or Get YouTube Transcript Extractor
Questions & Answers
Q: Why did gold face a setback?
Gold faced a setback because it broke out of its channel, falling below $1300, and may revisit the key support level at $1280.
Q: What is the outlook for Crude Oil?
Crude Oil has been moving sideways and has formed a support-turned-resistance level at $57.80. It is expected to break above $61.70 and potentially reach $63.70.
Q: What is the current situation of equity markets?
Equity markets experienced a sell-off in October 2018 and recently failed to surpass the resistance level at $2833. Unless this resistance is overcome, there is downside risk.
Q: What are the key levels to watch for Euro/USD?
Euro/USD has been following Fibonacci lines and currently faces a key support level at $111.76. If this level is broken, the pair may decline towards $108.50 and potentially even $103.41.
Summary & Key Takeaways
-
Gold bounced from the Fibonacci support level at $1280 and reached $1350, but recently broke out of a channel and may revisit the support level.
-
Crude Oil has been moving sideways and has formed a support level at $57.80. It is expected to break above $61.70 and target $63.70.
-
Equity markets experienced a sell-off in October 2018, and despite a recovery, failed to surpass the resistance level at $2833, indicating potential downside risk.
-
Euro/USD has been following Fibonacci lines and currently faces a key support level at $111.76. A break below this level may lead to a decline towards $108.50 and potentially even $103.41.
Read in Other Languages (beta)
Share This Summary 📚
Summarize YouTube Videos and Get Video Transcripts with 1-Click
Try YouTube Summary with ChatGPT & Claude or YouTube Transcript Generator
Explore More Summaries from InvestingChannel 📚
Summarize YouTube Videos and Get Video Transcripts with 1-Click
Try YouTube Summary with ChatGPT & Claude or YouTube Transcript Generator