Price Rate of Change (ROC) : Python Matplotlib Finance and Math Tutorials
TL;DR
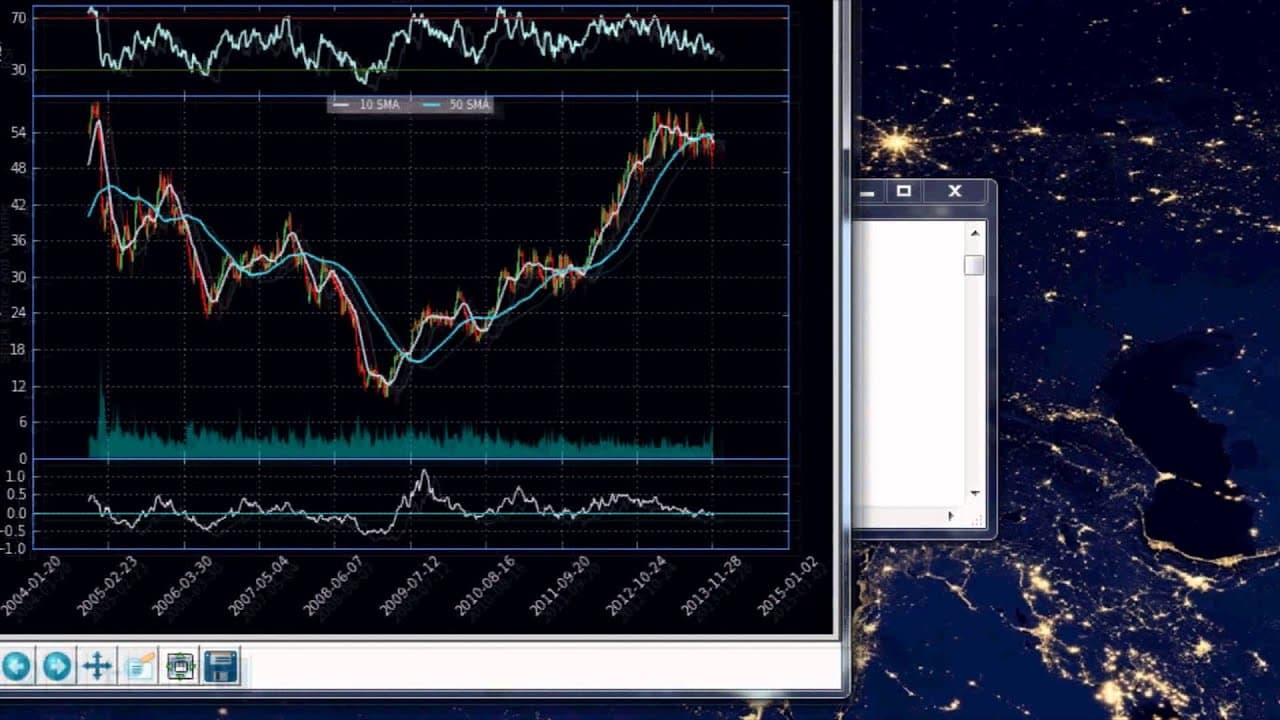
Learn how to calculate and chart the price rate of change (ROC) indicator using Python, which helps predict the directional movement of a stock price.
Transcript
what's going on everybody welcome to another python mathematics and finance indicators tutorial video in this video we're going to be discussing price rate of change or sometimes you'll see it as rate of change or roc this one's uh basically enough to where we can condense it all into one video so we're going to be covering the intro how to program... Read More
Key Insights
- ☠️ The ROC indicator measures the rate of change in a stock's closing price and helps predict its directional movement.
- ⌛ Different time frames for the ROC can produce varying levels of noise and accuracy in the indicator.
- 🫥 By comparing the ROC indicator to the zero line and analyzing its fluctuations, traders can identify potential buy and sell signals.
Install to Summarize YouTube Videos and Get Transcripts
Explore YouTube Video Summarizer or Get YouTube Transcript Extractor
Questions & Answers
Q: What is the purpose of the price rate of change (ROC) indicator?
The ROC indicator helps predict the direction of stock prices by calculating the percentage change in the closing price over a specified number of periods.
Q: How is the ROC indicator calculated?
The ROC is calculated by subtracting the closing price from 10 periods ago from the current closing price, dividing it by the closing price from 10 periods ago, and multiplying by 100.
Q: Is the ROC indicator a reliable predictor of stock price trends?
While the ROC indicator can provide valuable insights into price movements, it is not a foolproof trend predictor. It is best used in conjunction with other indicators and analysis techniques.
Q: Can the ROC indicator be customized for different time frames?
Yes, the time frame parameter in the Python code allows users to adjust the number of periods over which the ROC is calculated, making it adaptable to different trading strategies.
Summary & Key Takeaways
-
This video tutorial explains the concept of price rate of change (ROC) and how to program it in Python.
-
The ROC indicator calculates the percentage change in a stock's closing price over a given number of periods.
-
By charting the ROC, traders can predict the direction of stock prices and make buy or sell decisions.
Read in Other Languages (beta)
Share This Summary 📚
Summarize YouTube Videos and Get Video Transcripts with 1-Click
Try YouTube Summary with ChatGPT & Claude or YouTube Transcript Generator
Explore More Summaries from sentdex 📚


Summarize YouTube Videos and Get Video Transcripts with 1-Click
Try YouTube Summary with ChatGPT & Claude or YouTube Transcript Generator