Graphing a Basic Function | Summary and Q&A
TL;DR
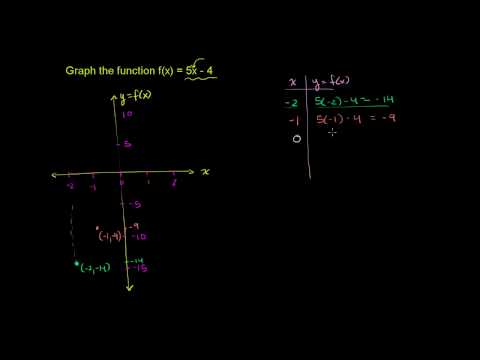
Learn how to graph the function f(x) = 5x - 4 step-by-step by sampling points from the domain.
Key Insights
- 😥 Graphing the function f(x) = 5x - 4 can be done by sampling points from the domain.
- #️⃣ The domain of f(x) = 5x - 4 is all real numbers.
- ☺️ The graph of f(x) = 5x - 4 is a straight line, indicating a linear relationship between x and f(x).
- 😥 By connecting the plotted points, the graph of f(x) = 5x - 4 can be visualized.
- 📈 This method of graphing provides a basic understanding of the function's behavior.
- 📈 The graph extends infinitely in both the positive and negative directions.
- 🏙️ The slope of the line is 5, and the y-intercept is -4.
Transcript
We're asked to graph the function f of x is equal to 5x minus 4. And we'll do it by really just sampling some points from the domain and seeing what value our function takes. And then we'll just graph those points. And then we'll connect the dots and see what forms. And there's other ways to do this, but this is the most simple or the most basic wa... Read More
Questions & Answers
Q: How is the function f(x) = 5x - 4 graphed?
The function is graphed by sampling points from the domain and plotting them on a graph. The x-values are chosen as negative 2, negative 1, 0, 1, and 2. The corresponding f(x) values are calculated and plotted on the y-axis.
Q: What is the general structure of the graph?
The graph of f(x) = 5x - 4 is a straight line. By connecting the plotted points, a line is formed, indicating a linear relationship between x and f(x).
Q: How can any point from the domain be plotted on the graph?
Since the domain of the function f(x) = 5x - 4 includes all real numbers, any x-value can be chosen and its corresponding f(x) value can be calculated to plot the point on the graph.
Q: Are there any limitations to this method of graphing?
This method of graphing only provides a sample of points from the domain. It does not plot every single value. However, it is sufficient to understand the general shape and pattern of the graph.
Summary & Key Takeaways
-
The video explains how to graph the function f(x) = 5x - 4 using a simple and basic method.
-
By sampling points from the domain and plotting them on a graph, the pattern of the function can be observed.
-
Connecting the sampled points results in a straight line, representing the graph of f(x) = 5x - 4.
Share This Summary 📚
Explore More Summaries from Khan Academy 📚